


Original Research
Evaluation of the Effectiveness of Risk Management in the Process of Acquisition of Information Technology in Public Administrations
- Abstract
- Full text
- Metrics
This research investigates the effectiveness of risk management in Information Technology (IT) acquisitions within public administrations. Despite existing regulations and the recognized importance of risk assessment in public procurement, the study highlights a persistent lack of maturity in risk management practices among public organizations. This deficiency, as evidenced by various federal accountability agencies, leads to increased costs, project delays, and the failure to achieve institutional objectives in IT projects. The literature review explores academic studies on risks in IT contracts, focusing on public procurement. It examines models and approaches to risk management, including supplier selection, contract continuity, and the development of systematic methodologies for managing risks in public sector IT acquisitions. The research emphasizes the critical need for effective risk management to ensure the success and efficiency of public IT procurements, given their complexity and financial relevance. The study evaluates whether normative frameworks developed over a decade in Brazil effectively influence managers’ decisions and foster the creation of robust risk treatment mechanisms. Specifically, it analyzes IT acquisition processes to determine if risk analysis genuinely impacts decision-making, leading to the implementation of controls such as contractual clauses or documented managerial actions. To achieve this, an evaluation instrument was developed, validated through focus groups with experts from oversight bodies, and applied to a sample of 100 ICT procurement processes from ten federal agencies. The data were analyzed using Self-Organizing Maps (SOM), enabling the calculation of a Quality Index and a Consistency Index. The results revealed low maturity in risk management practices, with evidence that risk analyses are often performed merely as formal compliance, without effectively influencing decision-making. The study contributes by providing an instrument for assessing the effectiveness of risk management in ICT procurement, supporting oversight bodies and managers in strengthening governance practices.
Darlan Henrique da Silva Venturelli1 , Tomás Roberto Cotta Orlandi2, João Souza Neto2
The acquisition of Information and Communications Technology (ICT) within the Federal Public Administration (FPA) has gained significant attention due to the high financial volumes involved and the increasing complexity of technological environments. These acquisitions encompass both tangible goods, such as hardware and infrastructure, and intangible services, such as software licensing and system development. Together, they represent strategic investments for the modernization of the state and the improvement of public services.
In the context of public procurement, contracts serve as instruments for allocating responsibilities and managing risks between parties. In Brazil, this allocation is shaped not only by contractual clauses but also by legal prerogatives established in legislation, such as Law 8.666/1993 and subsequent reforms, which provide the public administration with extraordinary powers to protect the public interest. Despite these safeguards, several rulings by the Federal Court of Accounts (TCU) and assessments by the Office of the Comptroller General (CGU) have revealed persistent deficiencies in ICT procurement, including failures in planning, weak monitoring of contract execution, and insufficient application of risk management practices.
Since 2008, ICT procurement in Brazil has been subject to a series of specialized regulations, gradually refined to respond to oversight findings (Brazil, 2008). The most recent milestone is Normative Instruction ME/SGD nº 1/2019, which introduced the obligation of continuous risk management throughout the procurement cycle. This innovation aligns Brazilian practice with international standards, notably ISO 31000:2018, which defines risk management as an integrated and dynamic organizational process.
Nevertheless, oversight reports demonstrate that despite more than a decade of regulatory evolution, the maturity of risk management practices in the FPA remains low. Recurrent problems such as cost overruns, delivery delays, and failures to meet institutional objectives are not caused by a lack of regulation but rather by the limited incorporation of a risk management culture into organizational routines.
Against this backdrop, the central research question of this study is: Does risk management in ICT procurement processes within the FPA achieve the effectiveness envisioned by Normative Instruction ME/SGD nº 1/2019?
This article seeks to answer this question by presenting the development and application of an evaluation instrument capable of measuring the effectiveness of risk management in ICT procurement processes. The analysis is based on 100 processes from ten federal agencies, and results are interpreted through both qualitative and quantitative lenses.
Literature Review
The literature on ICT procurement consistently highlights the risks associated with large-scale acquisitions in public administrations. These risks stem from information asymmetries, opportunistic behavior, deficiencies in supplier selection, and weak contract monitoring.
Pires et al. (2016) analyzed the Brazilian regulatory framework and argued that early versions of the IN nº 4 underestimated the role of risk management, treating it as a bureaucratic step rather than as a decision-support tool. Valencia and Azcarraga (2018), in a study of large ICT acquisitions in the Philippines, confirmed that risk arises from misaligned technical specifications and inadequate communication among stakeholders. Using principal-agent theory, they demonstrated how hidden factors and moral hazards negatively influence procurement outcomes, generating specification flaws and financial losses.
Chrisidu-Budnik and Przedańska (2017) emphasized that information asymmetry compromises contract effectiveness, since principals are often unable to fully monitor agents’ actions. This problem is particularly critical in ICT contracts, where complexity and technicality make monitoring more difficult.
From a governance perspective, Schuhmann and Eichhorn (2017) argued that contracts should be seen not merely as legal instruments but as governance tools for managing risk. Similarly, Tonkes and Vlasveld (2020) proposed the CATS CM model, which positions risks as central to contract objectives and requires continuous management throughout the contract lifecycle.
Supplier selection has been identified as another critical source of risk. Mousakhani and Ranjbar (2018) proposed a risk-oriented method for contractor evaluation, showing that reliance solely on price compromises procurement success. Instead, selection criteria must include reliability, technical expertise, and alignment with organizational goals.
In the Brazilian context, Parreira (2018) applied multicriteria modeling to IT service desk procurement, demonstrating how data-driven decision tools can enhance transparency and reduce risks. Cardoso and Alves (2020) introduced the GRATIC methodology, which systematizes lessons learned in ICT procurement through risk inventories and collaborative digital repositories.
Knowledge management has also been recognized as a dimension of risk. Massingham (2018) demonstrated how staff turnover leads to productivity losses and strategic misalignment, especially in contracts for ongoing services. Similarly, Nobre (2017) emphasized the need for systemic methodologies that integrate risk management into procurement practices, as illustrated in his study at the National Health Foundation.
Recent OECD monitoring shows that most countries have embedded integrity safeguards in procurement law—e.g., 95% report provisions to prevent private interests from influencing decisions and 83% set system-wide integrity principles—yet systematic enforcement remains uneven, underscoring the link between integrity management and risk control in public procurement (OECD, 2025b). Complementing this scholarly consensus, the OECD (2025a) emphasizes integrating risk assessment with contract-management systems, dashboards, audit trails, and performance indicators to proactively detect non-compliance and strengthen monitoring and evaluation (OECD, 2025a).
Finally, studies of supply chain vulnerabilities underline the importance of resilience. Kurniawan et al. (2017) showed that visibility, flexibility, and risk-aware organizational culture are decisive for reducing vulnerabilities in ICT supply chains.
Taken together, these studies converge on the idea that risk management must be continuous, systemic, and embedded in governance structures. In this sense, Public Procurement Law nº. 14.133/2021 represents a regulatory shift that modernizes procurement and reinforces instruments aligned with that premise—governance and planning mechanisms, strengthened controls, digital tools, and transparency throughout the contracting cycle. In this context, the law (and recent TCU guidance) underscores that the authorities and public agents of the procuring body or entity must act as the first line of defense against irregularities, while legal advisory bodies and internal control units constitute the second line of defense—encouraging continuous, permanent practices of risk management and preventive internal controls, with due consideration of implementation costs and benefits (Brazil, 2024b). However, both international and Brazilian literature identify a gap between regulation and practice, highlighting the importance of evaluating whether regulatory frameworks translate into effective managerial action.
Theoretical Framework
The theoretical foundations of this study are grounded in international standards, project management methodologies, and Brazilian regulatory instruments. ISO 31000:2018 establishes principles that define effective risk management as integrated, structured, inclusive, dynamic, and continuously improved (ABNT, 2018). These principles are universal and emphasize that risk management is not an isolated bureaucratic procedure but a core managerial function.
The PMBOK Guide 7th edition (PMI, 2017, 2021). and the PMI Process Groups (PMI, 2022). reinforce this perspective by framing risk management as a process that spans the entire project lifecycle, emphasizing the importance of stakeholder engagement and the allocation of risks to the parties best equipped to manage them Contracts themselves are instruments of risk allocation. The CATS CM model (Tonkes & Vlasveld, 2020) situates risk analysis at the heart of contract objectives, requiring updates throughout the contract’s lifecycle. In the public sector, contracts also incorporate legal prerogatives, such as “exorbitant clauses” (Miranda & Rocha, 2016), which allow unilateral action by the administration but whose effectiveness depends on proper risk analysis.
In Brazil, ICT procurement regulation evolved through successive Normative Instructions: IN nº 4/2008 introduced risk analysis in planning; IN nº 4/2010 (Brasil, 2010a) required that risk analysis permeate all procurement phases; IN nº 4/2014 (Brasil, 2014), updated with IN nº 4/2015 (Brasil, 2015) linked risk management to contract oversight; and IN nº 1/2019 consolidated these advances by mandating continuous risk management and the use of a Risk Management Map (Brasil, 2019a).
Oversight bodies have repeatedly diagnosed weaknesses. The TCU Acórdão nº 2.585/2012 (Brasil, 2012) highlighted recurring risks in IT projects; the TCU Acórdão nº 882/2017 (Brasil, 2017) noted the stagnation of maturity levels; and the TCU Acórdão nº 3.175/2020 reinforced the need for suppliers to engage in risk analysis (Brazil, 2020) and TCU Acórdão nº 2.699/2018 (Brasil, 2018) analyzes the governance and management capacity of 526 agencies and entities of the Federal Public Administration, indicates that 40% of public organizations are still at an early stage in structuring their contract management, revealing significant room for improvement. The same ruling also points out that the main deficiency lies in the difficulty organizations face in monitoring the performance of their contract management processes.
Finally, despite a decade of improvements in specialized regulations for ICT procurements, TCU rulings still reveal findings of merely formal procurement planning—with harmful consequences such as losses to the public treasury—as exemplified by TCU Ruling nº 2.037/2019 – Plenary (Brazil, 2019b). Collectively, these rulings demonstrate that despite regulatory advances, practice remains deficient.
According to the Operational Audit Manual of the Federal Court of Accounts (Brazil, 2010b), effectiveness refers to the relationship between results (observed impacts) and objectives (expected impacts). Therefore, Effective Risk Management is understood as the process that results in the treatment of risks through the establishment of controls capable of reducing priority risks to a level acceptable to the organization. Another point underscored by the TCU is that risk identification within the procurement function can be ineffective if risk owners are not designated (Brasil, 2024a). Hence, the effectiveness of risk management, in the context of this research, represents the extent to which the implemented controls and practices contribute to achieving the intended objectives and ensuring a consistent and sustainable approach to public procurement management.
Method
Research Design
This study is characterized as applied research, since it seeks to generate practical contributions to the improvement of governance in ICT procurement within the Brazilian Federal Public Administration (FPA). It also assumes a descriptive and exploratory nature, because it aims to map and analyze the maturity of risk management practices in procurement processes, based on existing regulations and the practices observed in federal agencies.
The methodological approach adopted was mixed, combining qualitative and quantitative techniques. The qualitative component consisted of the development of the evaluation instrument and its validation through focus groups with specialists from oversight bodies. The quantitative component corresponded to the application of this instrument to procurement processes and the statistical and computational analysis of the results.
Development of the Evaluation Instrument
The main methodological contribution of this research is the evaluation instrument designed to verify the effectiveness of risk management in ICT procurement. Its elaboration was based on the requirements of Normative Instruction ME/SGD nº 1/2019, which obliges public agencies to identify, assess, and treat risks throughout the procurement cycle, with the preparation and updating of a Risk Management Map. The instrument contained 17 questions, distributed across the three main stages of the procurement process:
Planning: verification of risk identification, assessment of probability and impact, documentation of treatment, and inclusion of controls.
Supplier selection: verification of whether risks related to suppliers were identified and whether the Risk Management Map was updated after the bidding phase.
Contract management: verification of periodic updates of the Risk Management Map, evidence of controls being applied, and registration of corrective measures.
To classify the responses, the following ordinal scale was adopted:
1 – No evidence of the creation of controls for identified risks.
2 – Evidence exists of the creation of controls for identified risks, without predominance.
3 – Evidence of the creation of controls for identified risks is predominant.
4 – Evidence exists of the creation of controls for all identified risks.
This scale allowed the evaluation of procurement processes not only regarding the presence of documents but also regarding the predominance of evidence and the comprehensiveness of risk control mechanisms.
Validation Through Focus Groups and Reliability of the Instrument
The instrument was submitted to focus groups composed of specialists from the Federal Court of Accounts (TCU) and the Office of the Comptroller General (CGU) to validate clarity, adequacy, and adherence to the prevailing regulatory framework. The experts confirmed the relevance of the items and suggested minor adjustments to improve wording in a few questions. This procedure strengthened the instrument and ensured its suitability for empirical application.
Sample Selection and Data Collection
To apply the instrument, access to procurement processes was requested through the Fala.BR platform, which is the official channel of the Brazilian Federal Government for information requests. A total of 64 agencies were contacted, and 10 provided complete responses that met the research requirements. From those, 100 ICT procurement processes were selected for analysis. A process was considered apt for application of the evaluation instrument if (a) the resulting contract was in force after the publication of Normative Instruction ME/SGD nº 1/2019, or (b) the process had been initiated more than one year earlier, with the contract already in force. Only processes with sufficient documentation were analyzed. These processes covered different types of ICT acquisitions, including software licensing, infrastructure services, system development, and support services.
Data Analysis Procedures
The answers to the 17 questions were consolidated into a database that enabled the construction of two synthetic indices: the Quality Index (QI) and the Consistency Index (CI). The purpose of this method was to assess agency behavior regarding risk management in ICT procurement through two indices:
Quality Index (QI): measures the degree to which each process adhered to the risk management practices established by IN nº 1/2019.
Consistency Index (CI): measures the regularity of each agency’s behavior in complying with the normative requirements for risk management across its processes.
The QI measures the proximity of each procurement process to a Benchmark representing the ideal process, in which all requirements of IN nº 1/2019 are fully met. Mathematically, the Benchmark is a vector in which all responses take the maximum value (4). The QI of a given process is the Euclidean distance between its response vector and the Benchmark vector. Lower distances indicate higher quality in terms of risk management.
The CI measures the degree of internal coherence of an institution’s processes. It is based on the Geometric Center (GC) of each organization’s set of processes. The CI corresponds to the average distance between each process and the institution’s GC; lower values indicate greater consistency in the application of risk management practices across different procurement processes.
To visualize the distribution of processes and identify similarity patterns, the study employed Self-Organizing Maps (SOMs) (Kohonen, 1997), an unsupervised technique that projects multidimensional data onto a two-dimensional grid while preserving topological relationships among input vectors. In this research, the SOM algorithm organized procurement processes according to their proximity to the Benchmark and to the GC, generating visual maps that allowed the identification of clusters with similar maturity levels.
It is important to emphasize that these indices are complementary. An agency may present:
· Low QI and low CI: consistent and high-quality practices.
· High QI and low CI: consistently poor practices.
· Low QI and high CI: some high-quality processes but with uneven application.
· High QI and high CI: both poor quality and inconsistency across processes.
Together, the QI and CI offer a consolidated perspective of the results, allowing not only the identification of best practices but also the recognition of systemic weaknesses that compromise the effectiveness of risk management in ICT procurement.
SOM Visualization
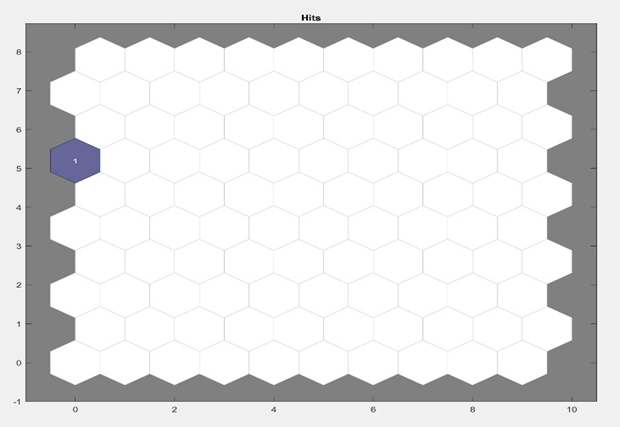
The Self-Organizing Maps (SOMs) provided deeper insight into the clustering of processes. Figure 1 illustrates an example of a SOM network.
SOM Network

In this study, the SOM network was employed to map both the consistency and quality of the processes analyzed from each agency. For this purpose, two reference points of interest were defined, serving as the basis for constructing the specific indices of consistency and quality.
The first point of interest is the representation of an optimal process, referred to as the Benchmark, illustrated in Figure 2. This point simulates a process that complied with all the risk management requirements established by Normative Instruction ME/SGD nº 1/2019. Figure 2 shows the Benchmark position on the SOM network.
Benchmark Position on the SOM Network
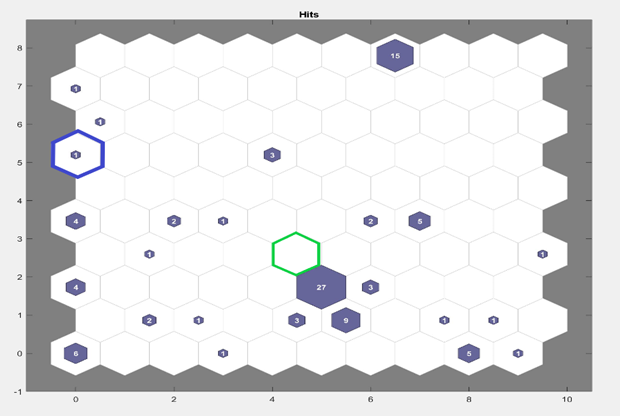
The second point of interest is the Geometric Center (GC) of the polygon formed by the nodes representing the position of each process on the map. To calculate the GC, the coordinates of each node were considered, and the arithmetic means of the X-axis and Y-axis coordinates were computed, resulting in the GC coordinate. Figure 3 presents the GC position within the SOM network, highlighted by green edges.
The positioning of processes within the SOM network was determined using the responses from the evaluation instrument applied to each process. Most questions in the instrument had a binary domain of answers (YES or NO), converted into 1 and 0, respectively. For questions with a numerical scale ranging from 0 to 4, the numerical response was directly used for the SOM modeling. At the end of the process, the values obtained for each question were aggregated, producing a score that qualified each process according to the evaluation instrument.
For the calculation of QI, the Euclidean distance between the GC of the polygon formed by the nodes representing each process in the agency and the Benchmark node was measured. The QI is inversely proportional to adherence: the greater the QI, the lower the quality of the processes regarding the implementation of risk management practices.
The CI reflects the degree of variability among an agency’s processes. It was calculated as the average distance between each node (representing a process) and the GC of the polygon formed by all processes of that agency. As with QI, CI is also inversely proportional: higher CI values indicate lower consistency in risk management practices.
It is important to note that an agency may present a low CI (high consistency) even when its QI is high (low quality). In such a case, the agency demonstrates regularity in consistently poor practices across different processes.
Figure 3 also provides an overview of the quality of processes analyzed, where each node represents the position of a process. The number in the center of each hexagon corresponds to the number of coincident processes in that position. The green-bordered hexagon highlights the GC for the set of 100 processes analyzed. The distance between the GC and the Benchmark was found to be six units (adjacent hexagons), out of a maximum possible distance of twelve units.
GC Position Within the SOM Network
Results
The application of the instrument to 100 procurement processes revealed a scenario of low maturity in risk management practices, though with important nuances across agencies and types of contracts.
Quality Index (QI)
The QI values showed a wide range. A small group of processes was located close to the Benchmark, indicating that all identified risks had controls created and documented, and that updates to the Risk Management Map were effectively performed. In these cases, the analysis revealed integration between risk management and decision-making, with clear evidence that contractual clauses reflected identified risks.
However, most processes had QI values significantly distant from the Benchmark. These processes exhibited partial documentation of risks, the absence of updates after contract signature, and controls described only in general terms. In extreme cases, the Risk Management Map existed merely as a template, without any content that influenced the conduct of the procurement.
Consistency Index (CI)
The CI analysis demonstrated high variability between institutions. Some agencies presented uniformly weak practices: although deficient, they were consistent across processes, reflecting an organizational pattern of formal but shallow compliance.
Other agencies exhibited high heterogeneity, with some processes well-documented and others lacking any evidence of effective risk management. This inconsistency suggests that practices depend on the maturity of individual teams or managers rather than being institutionalized. As shown, Figure 3 illustrates the distribution of QI values, showing the predominance of low-quality processes and the relative rarity of processes close to the ideal.
Statistical Analyses
After applying the evaluation instrument to one hundred procurement processes conducted by ten agencies, it was possible to extract important indicators that point to the level of effectiveness of risk management within the agencies that comprise the Federal System of Information Technology Resources Administration (SISP). To preserve the confidentiality of the agencies’ information and because this research seeks to provide a general overview of risk management in ICT procurement within the Brazilian Federal Public Administration (FPA), it was not the objective of the study to identify the agencies or the specific processes analyzed. Therefore, the agencies are anonymized and identified in the analyses as Agency 01, Agency 02, and so on.
When focusing on the planning phase of procurement, it was observed that 93% of the analyzed processes carried out, even if only formally, the actions required by Normative Instruction ME/SGD nº 1/2019. As a result, in these cases, the Risk Management Map was prepared in accordance with Article 38, §1 of the Normative Instruction. Conversely, 7% of the processes presented no evidence of any risk management action during the planning stage.
Regarding the evidence of the implementation of controls defined in risk response planning, the results showed that 19% of the processes analyzed had no evidence of the implementation of controls defined in the risk response plan, while 56% showed some evidence of implementation, but without predominance of this critical practice. Only 6% demonstrated evidence of implementing most of the planned controls, and 12% evidenced the implementation of all controls defined during the planning stage.
Another important finding is that, among the ten agencies analyzed, only one had a Risk Appetite Statement, as required by Article 38, §1, II of Normative Instruction ME/SGD nº 1/2019. Nevertheless, none of the processes from this agency indicated that risk management was guided by this organizational document.
In the supplier selection phase, it was found that only 8% of the processes recorded a relevant event that triggered a review of the Risk Management Map, in accordance with Article 38, §4, IV of the Normative Instruction. Additionally, only 7% of the processes had a Risk Management Map at the end of the supplier selection stage, as required by Article 38, §5.
Also, it was observed that 93% of the processes showed no risk management action during supplier selection. Of the 7% that did, 6% demonstrated evidence of creating controls for identified risks in a predominant manner, and only 1% evidenced the implementation of all planned controls during this phase.
In the contract management phase, the results were also concerning. The study observed that only 21% of the processes re-evaluated and updated previously identified risks during the planning and supplier selection phases, as required by Articles 38, §3, I and II of the Normative Instruction. In these cases, the Risk Management Map was updated at least once during contract execution, as required by Article 38, §3. Among these cases, 8% showed no implementation of controls defined for this phase, 7% implemented some controls without predominance, 5% implemented most of the controls (predominant), and only 1% demonstrated the implementation of all planned controls.
Additionally, only 6% of the processes recorded a relevant event during contract execution that generated new risks for the project, in line with Article 38, §4, IV, and elaborated a new Risk Management Map as a result.
Another relevant observation is that, among the 100 processes analyzed, 68% had contracts with at least one year of duration. However, only 8% updated their Risk Management Maps at least once annually, regardless of relevant events, and only 4% updated them at least once, even without completing one year of duration.
Finally, the analysis revealed that none of the agencies carried out actions to evaluate whether the implemented controls were capable of safeguarding and protecting public assets and resources against waste, loss, misuse, damage, unauthorized use, or misappropriation.
Comparative Index Analysis
Tables 1 and 2 show the Quality and Consistency Indices obtained using the two methods described in the method section (SOM visualization). A similarity was observed between the two methods, disregarding the deviations resulting from approximations.
CI obtained for the Agencies Analyzed Using the Two Methodologies (Graphical Analysis and Vector Distance)
|
Agency |
Consistency Index (Graphical Analysis) |
Consistency Index (Vector Distance) |
|
Agency 1 |
2.83 |
2.62 |
|
Agency 2 |
3.73 |
3.65 |
|
Agency 3 |
2.33 |
2.04 |
|
Agency 4 |
4.50 |
4.09 |
|
Agency 5 |
3.75 |
3.57 |
|
Agency 6 |
1.83 |
1.85 |
|
Agency 7 |
2.90 |
2.83 |
|
Agency 8 |
0.66 |
0.50 |
|
Agency 9 |
2.40 |
2.23 |
|
Agency 10 |
2.37 |
2.34 |
QI Obtained for the Agencies Analyzed Using the Two Methodologies (Graphical Analysis and Vector Distance).
|
Agency |
Quality Index (Graphical Analysis) |
Quality Index (Vector Distance) |
|
Agency 1 |
5 |
4.65 |
|
Agency 2 |
6 |
5.12 |
|
Agency 3 |
8 |
7.14 |
|
Agency 4 |
6 |
5.26 |
|
Agency 5 |
6 |
5.64 |
|
Agency 6 |
8 |
7.30 |
|
Agency 7 |
4 |
3.54 |
|
Agency 8 |
8 |
7.26 |
|
Agency 9 |
7 |
6.18 |
|
Agency 10 |
6 |
5.72 |
For this reason, to perform a comparative analysis between agencies, the measurement adopted was that obtained through the SOM graphical method, since it is a visual method and easier to interpret. The next step in comparing agencies was to calculate the inverse values of the indices, to make them directly proportional and then normalize the results. These values are presented in Table 3.
QI and CI of the Agencies Analyzed, Obtained by Graphical Analysis, Inverted and Normalized
|
Agency |
QI (Graphical) |
1/QI |
Normalized 1/QI |
CI (Graphical) |
1/CI |
Normalized 1/CI |
|
Agency 1 |
5 |
0.20 |
0.80 |
2.83 |
0.353 |
0.233 |
|
Agency 2 |
6 |
0.17 |
0.67 |
3.73 |
0.268 |
0.177 |
|
Agency 3 |
8 |
0.13 |
0.50 |
2.33 |
0.429 |
0.283 |
|
Agency 4 |
6 |
0.17 |
0.67 |
4.50 |
0.222 |
0.147 |
|
Agency 5 |
6 |
0.17 |
0.67 |
3.75 |
0.267 |
0.176 |
|
Agency 6 |
8 |
0.13 |
0.50 |
1.83 |
0.546 |
0.361 |
|
Agency 7 |
4 |
0.25 |
1.00 |
2.90 |
0.345 |
0.228 |
|
Agency 8 |
8 |
0.13 |
0.50 |
0.66 |
1.515 |
1.000 |
|
Agency 9 |
7 |
0.14 |
0.57 |
2.40 |
0.417 |
0.275 |
|
Agency 10 |
6 |
0.17 |
0.67 |
2.37 |
0.422 |
0.278 |
Figure 4 displays the inverted and normalized CI and QI data for the ten agencies, allowing a spatial analysis of the agencies’ distribution across these indices. As shown in Figure 4, the agency that achieved the best Quality Index (QI) was Agency 7, even though its Consistency Index (CI) was not among the lowest. Another observation is that Agency 1, which conducted the procurement process with the highest adherence to the requirements of Normative Instruction ME/SGD nº 1/2019 among the processes analyzed, presented a good QI but also a high CI. This demonstrates that, compared to other agencies, there is a high degree of variability in adherence to the regulation when considering its individual processes.
Inverted and Normalized CI and QI Data for the Ten Agencies
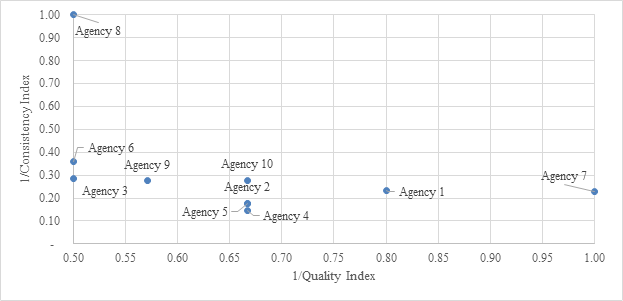
Another factor to be considered is that Agency 8 obtained the lowest CI, indicating a consistent behavioral pattern of the team during procurement and contract management. However, its QI was the worst among the group of agencies analyzed. This type of behavior suggests that adherence to the provisions of Normative Instruction ME/SGD nº 1/2019 depends strongly on the maturity of the team in procurement planning and contract oversight activities, rather than on an institutionalized organizational maturity in risk management.
Figure 4 also shows that agencies with high consistency tend to present low quality (QI). Conversely, agencies with the highest QI values (inverted and normalized), reflecting greater adherence to the regulation, did not maintain high consistency in their practices. This likely results from the presence of individual staff members with knowledge of risk management in contract management teams, rather than from an agency-wide maturity in risk management.
From this observation, it is recommended that agencies establish standardization mechanisms for the work of teams engaged in ICT procurement and contract management, especially with respect to risk management. Another factor that can influence QI is the prioritization of processes subject to risk management. For this reason, it is also important that agencies periodically define and review prioritization criteria to ensure that risk management efforts are appropriate to the complexity of each procurement process, while properly documenting such decisions.
As already noted, a good QI currently depends largely on the team involved in procurement and contract management, rather than on the agency itself. Therefore, it is essential to invest in staff training and in raising stakeholder awareness about the importance of risk management in procurement processes, so that agencies with the lowest QI can receive adequate capacity building.
The manager of Agency 7, which achieved the best QI but did not show a good CI, justified this outcome by the nature of the processes analyzed. The group of processes with very high QI consisted of new and complex acquisitions, which required strong attention from the team in risk management activities. In contrast, the group of contracts with lower QI comprised older, stable processes, managed by teams that were no longer at the agency. As a result, the manager concentrated most of the risk management effort on the first group, leading to overall high quality but only medium-level consistency.
Conclusion
The results of this study demonstrate that there is no consolidated risk management culture within the Brazilian Federal Public Administration (FPA). Consequently, the effectiveness of risk management in ICT procurement is limited. While many agencies formally comply with the provisions of Normative Instruction ME/SGD nº 1/2019, in practice most processes show low effectiveness, particularly in the implementation of planned risk controls. The research objectives were achieved:
The study evaluated 100 ICT procurement processes across 10 federal agencies, providing an overview of compliance with IN nº 1/2019.
The literature review identified relevant aspects of risk management in ICT procurement, despite the topic being underexplored in academic research.
An evaluation instrument was developed and validated, which allowed for the measurement of maturity levels through the Quality Index (QI) and Consistency Index (CI). These indicators provided an objective means of assessing the effectiveness of risk management.
The findings reveal that most agencies still treat risk management as a formal requirement rather than as an integrated governance practice. Instances of good practices were observed but were largely attributable to individual teams, not institutionalized processes. This highlights the need for standardization, capacity building, and continuous training to foster a culture of risk management.
From a methodological standpoint, the use of Self-Organizing Maps (SOMs) to derive and visualize QI and CI proved to be a valuable innovation. This approach not only enabled clustering of agencies according to their practices but also facilitated the identification of systemic weaknesses and isolated examples of good practices.
In summary, the study not only highlighted the lack of a risk management culture in Brazilian federal agencies but also delivered a practical tool for improvement. The combination of the evaluation instrument, Quality and Consistency Indices (QI and CI), and Self-Organizing Maps (SOMs) provides managers and oversight bodies with measurable indicators to monitor maturity in ICT procurement. This approach enables agencies to adopt the instrument as a self-assessment tool, prioritize processes requiring greater attention, and standardize risk management practices, thereby reducing costs, delays, and contract failures.
Future Research Opportunities
The study faced limitations, particularly the restricted number of agencies analyzed due to access constraints. Future research should expand the scope of the sample, including more agencies and processes, to produce broader generalizations.
Furthermore, this study focused on the framework established by Normative Instruction ME/SGD nº 1/2019, regulatory evolution has continued. The publication of Normative Instruction SGD/ME nº 94/2022 (Brasil, 2022), after the completion of this research, represents a further step in consolidating and expanding risk management requirements in ICT acquisitions.
IN 94/2022 provides more detailed guidance on the planning phase of procurement, including requirements for comprehensive risk identification, assignment of responsibilities, and the documentation of risk treatment measures. It also strengthens the obligation for continuous monitoring of risks throughout the contract lifecycle, fostering integration with governance and internal control mechanisms.
Future research could revisit the evaluation instrument developed here, applying it under the framework of IN 94/2022 to determine whether the new regulation has led to measurable improvements in maturity. Comparative designs (e.g., quasi-experiments or difference-in-differences) between the periods governed by IN 1/2019 and IN 94/2022 would offer valuable insights into the impact of regulatory changes on procurement practices. Additionally, the TCU’s 2024 handbook on guidance and case law (Brazil, 2024a) highlights the importance of documenting the effectiveness of controls (rather than their mere existence), naming risk owners, quantifying risks in alignment with the estimated contract value (including any risk rate), and linking risk treatment to performance monitoring (SLA/SLI) and contract-management routines—elements that future studies should explicitly incorporate into measurement models.
Within the same regulatory context as IN 94/2022, other specific regulations govern acquisition practices. For example, SGD/MGI Ordinance No 6,679 of September 17, 2024 amends SGD/MGI Ordinance No 750 of March 20, 2023, establishing specific rules for procuring software development, maintenance, and sustainment services within federal agencies and entities. Likewise, SGD/MGI Ordinance No 6,055 of 2025 amends SGD/MGI Ordinance No 1,070 of June 1, 2023, which sets out a model for procuring information and communications technology (ICT) infrastructure operation and user support services. These ordinances should also be taken into account in future studies that examine risk management in procurements within more specific contexts.
Additionally, OECD (OECD, 2025a) highlights the importance of documenting the effectiveness of controls (rather than their mere existence), assigning risk ownership, aligning risk quantification with estimated contract value, and linking risk treatment to performance monitoring (e.g., SLA/SLI) within contract-management routines—elements that future studies should explicitly incorporate into measurement models. Future work should test whether blended integrity-and-risk controls—emphasised by the OECD as necessary for resilient procurement systems—improve maturity scores and trust outcomes when implemented as part of continuous monitoring frameworks (OECD, 2025b).
In conclusion, longitudinal studies could examine whether the introduction of IN 94/2022 contributes to the institutionalization of a risk-management culture, moving beyond formal compliance toward effective practices that improve procurement efficiency and safeguard public resources. Another promising avenue is the stronger application of artificial intelligence (AI) tools and methods to enhance risk identification, monitoring, and control testing—aligned with ISO/IEC 42001 requirements for governance, lifecycle risk treatment, model change control, and supplier oversight (ISO/IEC, 2023).
References
Associação Brasileira de Normas Técnicas (ABNT). (2018). ISO 31000: Gestão de Riscos – Diretrizes [ISO 31000: Risk Management – Guidelines]. ABNT.
Brasil. Ministério do Planejamento, Orçamento e Gestão. Secretaria de Logística e Tecnologia da Informação. (2008). Instrução Normativa SLTI/MPOG nº 4, de 19 de maio de 2008 [Normative Instruction SLTI/MPOG No. 4, May 19, 2008]. Diário Oficial da União.
Brasil. Ministério do Planejamento, Orçamento e Gestão. Secretaria de Logística e Tecnologia da Informação. (2010a). Instrução Normativa SLTI/MPOG nº 4, de 12 de novembro de 2010 [Normative Instruction SLTI/MPOG No. 4, November 12, 2010]. Diário Oficial da União.
Brasil. Tribunal de Contas da União. (2010b). Manual de Auditoria Operacional – 3. ed. [Operational Audit Manual – 3rd ed.]. Secretaria de Fiscalização e Avaliação de Programas de Governo (Seprog).
Brasil. Tribunal de Contas da União. (2012). Relatório de Levantamento: Acórdão nº 2.585/2012 – Plenário [Survey Report: Decision No. 2.585/2012 – Plenary]. Diário Oficial da União.
Brasil. Ministério do Planejamento, Orçamento e Gestão. Secretaria de Logística e Tecnologia da Informação. (2014). Instrução Normativa SLTI/MPOG nº 4, de 11 de setembro de 2014 [Normative Instruction SLTI/MPOG No. 4, September 11, 2014]. Diário Oficial da União.
Brasil. Ministério do Planejamento, Orçamento e Gestão. Secretaria de Logística e Tecnologia da Informação. (2015). Instrução Normativa SLTI/MPOG nº 4, de 19 de março de 2015 [Normative Instruction SLTI/MPOG No. 4, March 19, 2015]. Diário Oficial da União.
Brasil. Tribunal de Contas da União. (2017). Relatório de Levantamento: Acórdão nº 882/2017 – Plenário [Survey Report: Decision No. 882/2017 – Plenary]. Diário Oficial da União.
Brasil. Tribunal de Contas da União. (2018). Relatório de Acompanhamento: Acórdão nº 2.699/2018 – Plenário [Monitoring Report: Decision No. 2.699/2018 – Plenary]. Diário Oficial da União.
Brasil. Ministério da Economia. Secretaria de Governo Digital. (2019a). Instrução Normativa SGD/ME nº 1, de 4 de abril de 2019 [Normative Instruction SGD/ME No. 1, April 4, 2019]. Diário Oficial da União.
Brasil. Tribunal de Contas da União. (2019b). Relatório de Auditoria: Acórdão nº 2.037/2019 – Plenário [Audit Report: Decision No. 2.037/2019 – Plenary]. Diário Oficial da União.
Brasil. Tribunal de Contas da União. (2020). Representação: Acórdão nº 3.175/2020 – Plenário [Representation: Decision nº. 3.175/2020 – Plenary]. Diário Oficial da União.
Brasil. Ministério da Economia. Secretaria de Governo Digital. (2022). Instrução Normativa SGD/ME nº 94, de 23 de dezembro de 2022 [Normative Instruction SGD/ME nº 94, December 23, 2022]. Diário Oficial da União.
Brasil. Ministério da Gestão e da Inovaçãoe m serviços Públicos. Secretaria de Governo Digital. (2024). Instrução Normativa SGD/Portaria SGD/MGI nº 6.679, de 17 de setembro de 2024 (2024) [Ministry of Management and Innovation in Public Services, Secretariat of Digital Government. SGD/MGI Ordinance No. 6,679, September 17, 2024.] Diário Oficial da União.
BRASIL. Tribunal de Contas da União (2024a). Licitações & Contratos: Orientações e Jurisprudência do TCU / Tribunal de Contas da União. [Procurement & contracts: Guidance and case law of the TCU]. 5ª Edição, Brasília: TCU, Secretaria-Geral da Presidência.
Brazil Tribunal de Contas da União. (2024b). Representação: Acórdão nº 1917/2024 – Plenário [Representation: Decision nº 1917/2024 – Plenary]. Diário Oficial da União
Brasil. Ministério da Gestão e da Inovaçãoe m serviços Públicos. Secretaria de Governo Digital. (2025). [Ministry of Management and Innovation in Public Services, Secretariat of Digital Government. SGD/MGI Ordinance No. 6,055, 2025: Amending Ordinance SGD/MGI No. 1,070/2023 to establish the model for contracting ICT infrastructure operation and user support services]. Diário Oficial da União.
Cardoso, F. F., & Alves, C. F. (2020). GRATIC: Uma metodologia para gestão de riscos em aquisições de TIC [GRATIC: A methodology for risk management in ICT procurement]. In Anais do Workshop de Computação Aplicada em Governo Eletrônico (WCGE) (pp. 36–47). Sociedade Brasileira de Computação. https://doi.org/10.5753/wcge.2020.11256
Chrisidu-Budnik, A., & Przedańska, J. (2017). The agency theory approach to the public procurement system. Wroclaw Review of Law, Administration & Economics, 7(1), 154–165.
ISO/IEC. (2023). ISO/IEC 42001: Artificial intelligence management system — Requirements.
Kohonen, T. (1997). Self-organizing maps (Series in Information Sciences, Vol. 30). Springer.
Kurniawan, R., Zailani, S. H., Iranmanesh, M., & Rajagopal, P. (2017). The effects of vulnerability mitigation strategies on supply chain effectiveness: Risk culture as moderator. Supply Chain Management, 22(1), 1–15. https://doi.org/10.1108/SCM-12-2015-0482
Massingham, P. R. (2018). Measuring the impact of knowledge loss: A longitudinal study. Journal of Knowledge Management, 22(4), 721–758. https://doi.org/10.1108/JKM-08-2016-0338
Miranda, I., & Rocha, D. (2016). A possibilidade de alocação de riscos nos contratos administrativos regidos pela Lei 8.666/93 à luz do direito, à manutenção do equilíbrio econômico-financeiro [The possibility of allocating risks in administrative contracts governed by Law 8.666/93 in light of the right to maintain the economic-financial balance]. Revista Científica Fagoc Jurídica, 1, 1–15.
Mousakhani, E., & Ranjbar, S. (2018). Identification and evaluation of criteria for selecting contractors using a risk management approach. Organization, Technology & Management in Construction, 10(1), 1747–1760.
Nobre, L. S. (2017). Proposta de metodologia de gestão de riscos para as contratações de TI na Funasa [Proposed risk management methodology for IT procurements at Funasa] [master’s dissertation, Universidade de Brasília].
OECD. (2025a). Digital transformation of public procurement. OECD Publishing.
OECD. (2025b). Implementing the OECD Recommendation on Public Procurement in OECD and partner countries. OECD Publishing
Parreira, G. C. (2018). Modelo de decisão para gestão de riscos de contratos de serviços de TI no Poder Judiciário Brasileiro [Decision model for risk management of IT service contracts in the Brazilian Judiciary] [master’s dissertation, Universidade de Brasília].
Pires, T. G., Cavalcante, S. M., Corrêa, D. M. M., & Neto, D. M. M. C. (2016). Gestão de riscos nas aquisições de soluções de TI: Uma análise crítica dos modelos de boas práticas [Risk management in the procurement of IT solutions: A critical analysis of good-practice models]. In Anais do Encontro Anual de Tecnologia da Informação (EATI) e Simpósio de Tecnologia da Informação da Região Noroeste do RS (STIN).
Project Management Institute (PMI). (2017). A guide to the Project Management Body of Knowledge (PMBOK® Guide) (6th ed.). Project Management Institute.
Project Management Institute (PMI). (2021). A Guide to the Project Management Body of Knowledge (PMBOK® Guide) (7th ed.). Project Management Institute.
Project Management Institute (PMI). (2022). Process Groups: A Practice Guide. Project Management Institute.
Schuhmann, R., & Eichhorn, B. (2017). Reconsidering contract risk and contractual risk management. International Journal of Law and Management, 59(4), 504–521. https://doi.org/10.1108/IJLMA-02-2016-0023
Tonkes, L., & Vlasveld, G. J. (2020). Contract management with CATS CM® version 4: From working on contracts to contracts that work. Bernan Distribution. [ISBN 9789401806862].
Valencia, P. L. V., & Azcarraga, A. (2018). Principal-agent theory in the examination of technical specifications used in government information technology procurement. Proceedings of the 22nd Pacific Asia Conference on Information Systems (PACIS 2018).
Page 1 of
Download Count : 15
Visit Count : 67
Keywords
Scientific Production Crowdfunding; Financing; Access to Capital; Innovation
Author(s) Information


How to cite this article:
Venturelli, D., Orlandi, T. R. C. & Souza Neto, J. (2025). Evaluation of the effectiveness of risk management in the process of acquisition of information technology in public administrations. New Challenges in Accounting and Finance, 14, 14-32. https://doi.org/10.32038/NCAF.2025.14.02
Acknowledgments
Not applicable.
Funding
Not applicable.
Conflict of Interests
No, there are no conflicting interests.
Open Access
This article is licensed under a Creative Commons Attribution 4.0 International License, which permits use, sharing, adaptation, distribution and reproduction in any medium or format, as long as you give appropriate credit to the original author(s) and the source, provide a link to the Creative Commons license, and indicate if changes were made. You may view a copy of Creative Commons Attribution 4.0 International License here: http://creativecommons.org/licenses/by/4.0/