


Case Study
Identification of the Profile of Participants in the National University Entrance Exam in Brazil
- Abstract
- Full text
- Metrics
This study aims to identify the profile of participants in the Exame Nacional do Ensino Médio (ENEM) in Brazil, analyzing data from the last six editions of the exam. As a key educational public policy, ENEM serves as the main large-scale evaluation for high school students, influencing both higher education access and basic education quality indicators. The methodology involved processing and cleaning INEP's microdata, resulting in a refined dataset of 4,644,946 records from a total of 27,191,905 candidates. The analysis focused on the impact of the COVID-19 pandemic on registration and participation rates, noting a significant drop in candidates and a change in attendance patterns, particularly in 2020. Furthermore, the research characterized the performance of candidates across the four knowledge areas and the essay, highlighting the importance of data presentation for effective communication. The findings underscore the need for continuous monitoring of the exam's dynamics to inform educational policies and ensure equitable access to higher education, particularly amid external factors such as the pandemic.
Identification of the Profile of Participants in the National University Entrance Exam in Brazil
Wagner de Oliveira Pequeno1, Tomás Roberto Cotta Orlandi2, Mac Amaral Cartaxo3, Paulo Campanha Santana4
1,2University of Brasília – UnB, Brazil
3University SENAC of Brasília, Brazil
4University Mackenzie of Brasília, Brazil
ABSTRACT
This study aims to identify the profile of participants in the Exame Nacional do Ensino Médio (ENEM) in Brazil, analyzing data from the last six editions of the exam. As a key educational public policy, ENEM serves as the main large-scale evaluation for high school students, influencing both higher education access and basic education quality indicators. The methodology involved processing and cleaning INEP's microdata, resulting in a refined dataset of 4,644,946 records from a total of 27,191,905 candidates. The analysis focused on the impact of the COVID-19 pandemic on registration and participation rates, noting a significant drop in candidates and a change in attendance patterns, particularly in 2020. Furthermore, the research characterized the performance of candidates across the four knowledge areas and the essay, highlighting the importance of data presentation for effective communication. The findings underscore the need for continuous monitoring of the exam's dynamics to inform educational policies and ensure equitable access to higher education, particularly amid external factors such as the pandemic.
KEYWORDS: ENEM (Exame Nacional do Ensino Médio), Educational Evaluation, Microdata Analysis, Higher Education Access, COVID-19 Impact
Introduction
The evaluation process is part of the educational public policy, aiming to collaborate with the validity of the quality of development advocated by the actions and strategies implemented with the objective of achieving the integral formation of students (BRASIL, 1996).
The school evaluation process in Brazil is specified in the Lei de Diretrizes e Bases da Educação (Law of Directives and Bases of Education - LDB) 9.394 of 1996, in Art. No. 24, paragraph V, which specifies the focus and expected consequences in verifying school performance, acceleration, achievement, and advancement of studies, as well as parallel recovery.
For Luckesi (Luckesi, 2022), the process of evaluating is “[…] an act of investigating the quality of reality, a fact that implies knowledge, whether acquired through common sense resources or as a result of the use of methodologically consistent procedures […]” (p. 27), that is, verifying what reality presents in terms of achieving something objectively.
In addition to temporal aspects, the National Common Curricular Base (BNCC) points to the type of education oriented towards the new educational context, based on the texts of LDB 9.394/1996, referring to the evaluation process in a very specific way: to construct and apply formative evaluation procedures of process or result that take into account the contexts and learning conditions, taking such records as a reference to improve the performance of the school, teachers, and students […]. (BRASIL, 2017).
Formative evaluation is the ideal process to be carried out in accordance with contexts and modalities, teaching stages, and throughout basic education, to improve the performance of the entire school community and to focus on the integral formation of the student, without changing the social issue related to evaluation.
The social problem is perceived because the school evaluation process excludes when it classifies, when it differs from the teaching proposal, and when it aims to find the quantity rather than the quality of learning. Many young people abandon their studies due to school failure (Freitas & Sordi, 2021).
School evaluation has evolved and, in modernity, has taken on other functions, more focused on verifying learning and resolving common problems in students' daily lives, and not only on students but also on education professionals, organizations, and educational institutions (Schwartzman, 2011).
Educational evaluation is an essential tool for monitoring student performance and subsidizing public policies. In Brazil, the Exame Nacional do Ensino Médio- ENEM (National High School Exam) has consolidated as the main large-scale evaluation, allowing not only selection for higher education but also providing indicators on the quality of basic education. In parallel, the PISA (Programme for International Student Assessment) enables comparisons of the Brazilian educational system with other countries, identifying opportunities for improvement.
COVID-19 directly impacted teaching and school evaluations. With the closure of schools and the emergency adoption of remote learning, there was an increase in inequality in access to technology and a drop in student performance, especially among low-income students. This situation influenced the ENEM results, affecting participation and reflecting learning difficulties during the isolation period.
Furthermore, the health crisis brought challenges to the continuity of educational policies, requiring adaptations to teaching and evaluation processes. Emergency measures were implemented to minimize the impacts of the pandemic, including curricular flexibility and expanded technological resources. However, post-pandemic ENEM and PISA data demonstrate learning gaps and the need for effective strategies for educational recovery.
Exame Nacional do Ensino Médio – ENEM (National High School Exam)
The Exame Nacional do Ensino Médio – ENEM (National High School Exam) is one of the means of entry into higher education. The body responsible for its annual application is the Instituto Nacional de Educação e Pesquisa Anísio Teixeira (INEP). After its realization, the Institute makes exam’s microdata available on its electronic site (BRASIL, 2023).
In the educational field, the ENEM emerged in 1998, with several educational objectives, among them providing citizens with a parameter for self-assessment. After the exam is corrected, each student receives their individual result, and global data is also sent to schools, serving as an important collective indicator for the institutions.
In the section of Brazil’s Federal Constitution of 1988 that addresses education, Article 205 provides that education is a right of the population and a duty of the State. It emphasizes that it “shall be promoted and encouraged with the collaboration of society, aiming at the full development of the person, their preparation for the exercise of citizenship, and their qualification for work.”
In it, there is article 206, which lists several guiding principles of teaching, among them the principle of equality of access to school. The 208 article defines the State’s duty in education as guaranteeing access to all levels of research, teaching, and artistic creation, according to each person’s capacity (item V), among other measures.
In this context, the then Minister of State for Education and Sports, through Ordinance No. 438, of May 28, 1998, instituted the National High School Exam. Article 1 of this norm established it as a student performance evaluation procedure, with the following objectives: 1) to give the citizen a parameter for self-assessment, with a view to the continuity of their education and labor market insertion (item I); 2) to create a reference for high school graduates (item II); 3) to make subsidies to the modalities of access to higher education (item III); 4) to constitute a modality of access to post-high school professional courses (item IV); 5) to promote certification at the high school completion level, in accordance with current legislation (item V); 6) to do the evaluation of the school performance and the academic performance of those entering undergraduate courses (item VI).
This ordinance provides that INEP will structure a database and issue reports with the ENEM results, which will be available to higher education institutions, state education secretariats, and researchers, with the objective of deepening and expanding analyses of interest to society (article 6).
This exam is used to select scholarship applicants for the University for All Program (ProUni). It enables both full and partial scholarships (50% of the course tuition) for undergraduate and sequential courses, in private higher education institutions. In addition to this program, the ENEM result is used by 500 Higher Education Institutions in Brazil, which complements or replaces the Institution’s entrance exam.
Annually, INEP, through the Directorate of Basic Education Evaluation, discloses the evaluation Microdata, with the care resulting from the Lei Geral de Proteção de Dados LGPD (General Data Protection Law), 13,709, 08/14/2018. In the year 2020, the areas of knowledge and the curricular components of the exam were in Table 1.
Description of ENEM Knowledge Areas and Curricular Components
|
Knowledge Area |
Curricular Components |
|
Languages, Codes, and their technologies |
Literature, Portuguese Language, Foreign Language (Spanish or English), Physical Education, Arts and Information and Communication Technologies. |
|
Human Sciences and their technologies |
Philosophy, Geography, History and Sociology. |
|
Natural Sciences and their technologies |
Physics, Biology and Chemistry. |
|
Mathematics and its technologies |
Mathematics. |
Source: ENEM Microdata (Brasil, 2023)
The Exame Nacional do Ensino Médio - ENEM (National High School Exam) and the Programme for International Student Assessment are two important educational evaluations, but with distinct objectives and methods.
ENEM aims to evaluate school performance at the end of high school in Brazil. Regarding its application, it is held annually for students who are concluding or have already concluded high school. Results are used for higher education access in Brazilian universities and as an indicator of high school quality.
The PISA aims to evaluate global educational systems of 15-year-olds by testing their skills and knowledge. The application is carried out every three years, in various member and non-member countries of the OECD. It is mainly used to compare students’ ability to apply their knowledge in daily life situations and to analyze educational policies. The areas evaluated are: Reading, Mathematics, and Science, with a rotating focus in each edition. PISA is an important tool for understanding how educational systems prepare young people for the challenges of the modern world and for adult life, and it serves as a global reference for improving education.
In general terms, we can mention that ENEM is national, while PISA has an international scope; ENEM is more focused on entry into higher education, while PISA seeks to provide comparative data between countries.
Information Presentation
According to Edward Tufte (TUFTE, 1983), in his work The Visual Display of Quantitative Information (1983), clarity in visual presentation is fundamental, as it allows complex information to be understood quickly and effectively. When data is presented clearly and organized, the following benefits are achieved:
1. Quick Understanding: Well-designed graphs, tables, and infographics allow the audience to absorb essential information at a glance. Clarity avoids confusion and facilitates interpretation.
2. Informed Decision Making: A clear visual presentation helps identify patterns, trends, and insights. This is crucial for making informed decisions in areas such as business, science, and politics.
3. Audience Engagement: An engaging visual presentation maintains audience interest. Visually pleasing graphs encourage exploration and deepening of the data.
4. Error Reduction: When information is presented clearly, there is less likelihood of misinterpretations or reading errors.
5. Efficient Message Transmission: Visual clarity allows you to convey complex messages concisely. This is especially important in presentations, reports, and educational materials.
In summary, clarity in visual presentation is essential for communicating information effectively and impactfully.
The Analysis of Data
This research data was processed in the second semester of 2024, using INEP’s currently available microdata, for an analysis of the last six exams. As part of this treatment process, the files were loaded and analyzed to identify the largest possible number of records corresponding to the candidates’ questionnaire responses for a census analysis of the candidates. Unfortunately, candidates do not treat the completion stage as important, which is one of the article's objectives: identifying the candidate’s profile.
The files correspond to the volume of candidates registered for the exam. Table 2 shows the number of registered candidates for each year. The number of registrations showed a uniform distribution between the years 2018 and 2020. The year 2020 is a temporal landmark due to the COVID-19 pandemic (OPAS, 2024). As isolation procedures began in March of that year and a short isolation period was predicted, registrations were not affected. However, with the extension of the period and the continuation of isolation measures, the year 2021 saw a drop in the number of registered candidates. 2022 marked the beginning of a return to normalcy in daily activities, but it did not lead to a significant increase in the number of registered candidates for the exam.
Number of Registered Candidates per ENEM Year
|
Year |
Registered Candidates |
|
2018 |
5,513,733 |
|
2019 |
5,095,171 |
|
2020 |
5,783,109 |
|
2021 |
3,389,832 |
|
2022 |
3,476,105 |
|
2023 |
3,933,955 |
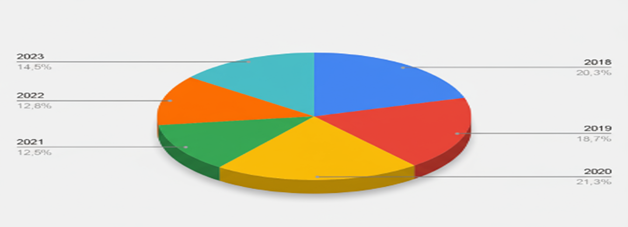
Figure 1 shows the distribution of candidates in each year. In an initial distribution hypothesis, approximately 20% of the candidates appear in each exam. Due to COVID-19-related factors, we had above-average volumes from 2018 to 2020, with 2020 registering the largest number of candidates, followed by a drop of more than 5% in 2021 and 2022.
Percentage Distribution of Registered Candidates per Year
Participation on exam days is significantly lower than the number of registered candidates. The exams occur on two consecutive Sundays, on two weekends in November, with the Human Sciences (CH), Languages and Codes (LC), and Essay exams on the first day. Mathematics (MT) and Natural Sciences (CN) on day two of the exam. In addition to presence, the candidate can still be eliminated during the exam. As the number of eliminated candidates is insignificant, Figure 2 shows the quantities of participation and absences in the period 2018-2022. The year 2020 is a divider in the volume of attendance and absence of candidates, due to the average of 279 days of suspension of activities (INEP, 2021), which had a direct impact on absences on the exam days. The year 2020 was the only year with more absences than attendance on both days of the exam. The volume of attendance is below that of 2019, the last year of the exam before the pandemic, but shows a tendency to increase participation. A characteristic is the increase in absences on the second day.
Candidate Participation on Exam Days
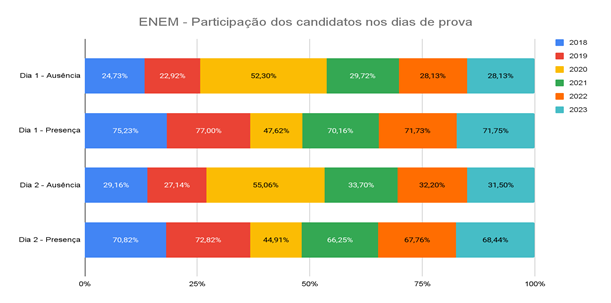
In Table 3, we observe that the impact of holding the exam during the pandemic was 5% lower than in years when classes took place normally. Thus, monitoring the decrease in absences to near 20% and the increase in attendance to above 70% will indicate that we are back to the exam's normality in relation to the pandemic.
Impact of the Pandemic on Average Participation on Exam Days
|
|
Day 1 Absence |
Day 1 Attendance |
Day 2 Absence |
Day 2 Attendance |
|
Average |
30.99% |
68.92% |
34.79% |
65.17% |
|
Average (without 2020) |
26.73% |
73.17% |
30.74% |
69.22% |
Data Cleaning
The microdata for each year the exams were held are available from the National Institute for Educational Studies and Research Anísio Teixeira (INEP), in the microdata area, including participants’ scores and questionnaire data collected at the time of the candidate’s registration. This data characterizes the performance and profile of the candidates for that year. For the realization of this work, some data were considered important for a good characterization of the candidates. The fields are described in Table 4.
List of ENEM Microdata Fields
|
Field Name |
Description |
|
‘NU_ANO’ |
ENEM Year |
|
‘SG_UF_ESC’ |
Acronym of the candidate’s state of residence |
|
‘TP_FAIXA_ETARIA’ |
Candidate’s age in the year of the exam |
|
‘TP_SEXO’ |
Gender identification |
|
‘TP_ESTADO_CIVIL’ |
Marital status identification |
|
‘TP_COR_RACA’ |
Identification of self-declared Color/Race |
|
‘TP_ST_CONCLUSAO’ |
Identification of the high school completion status in the year the ENEM was taken |
|
‘TP_ANO_CONCLUIU’ |
Identification of the year the candidate concluded/will conclude High School |
|
‘TP_ESCOLA’ |
Identification of the type of school the candidate attended |
|
‘TP_ENSINO’ |
Identification of the teaching modality (regular, EJA) |
|
‘SG_UF_ESC’ |
Acronym of the candidate’s school’s state |
|
‘TP_LOCALIZACAO_ESC’ |
Identification of the school’s location (Urban/Rural) |
|
‘NU_NOTA_CN’ |
Candidate’s score in Natural Sciences |
|
‘NU_NOTA_CH’ |
Candidate’s score in Human Sciences |
|
‘NU_NOTA_LC’ |
Candidate’s score in Languages and Codes |
|
‘NU_NOTA_MT’ |
Candidate’s score in Mathematics |
|
‘TP_LINGUA’ |
Identification of the type of foreign language selected for the exam |
|
‘TP_STATUS_REDACAO’ |
Identification of the essay status |
|
‘NU_NOTA_REDACAO’ |
Candidate’s score in the essay |
When loading data from the fields, some records lacked information in all exam editions. Candidates answer a profile questionnaire for qualification purposes, and because it is a long list of questions, many questions were left unanswered. In this sense, to ensure a homogeneous set of data for the analyses, all records with any field containing no information were removed. Thus, after this cleaning, 4,644,946 records remained with information in all fields, out of the 27,191,905 candidates, corresponding to 17.08% of the total.
After this process, the Completion Status field lost relevance. The exam allows candidates to take the test as part of their training for when they finish high school. The TP_ST_CONCLUSAO field, after data cleaning, only contained candidates who had already completed high school. Given this, the comparison of performance using the time since graduation as a parameter cannot be used.
Candidate Profile
Gender
The female gender has greater participation in the exam in all years. This reflects the distribution of students in high school, the final stage of basic education, where we observe a majority of female participation (INEP, 2024), with 50.9% enrolled and lower repetition and dropout rates than among males. Figure 3 shows the expressive quantity of female participants in the exams.
Candidates by Gender
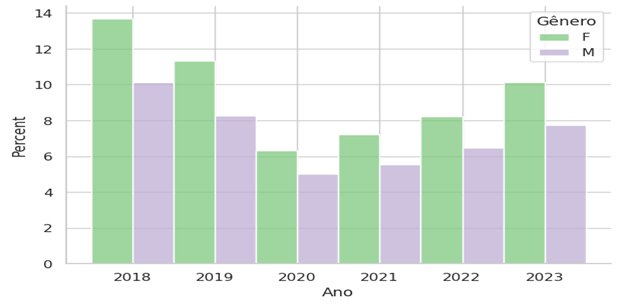
Table 5 presents the percentage distribution by year for each exam. This difference presents an average of 13.34% for the female gender in all years, with the largest difference of 15.53% in 2019 and the closest value in 2020 at 11.34%. It should be noted that this distribution also includes candidates who graduated in previous years, suggesting that men do not continue to take the exam over time.
Annual Percentage of Participants by Gender
|
Year |
Female |
Male |
|
2018 |
57.49% |
42.51% |
|
2019 |
57.76% |
42.24% |
|
2020 |
55.67% |
44.33% |
|
2021 |
56.55% |
43.45% |
|
2022 |
55.92% |
44.08% |
|
2023 |
56.63% |
43.37% |
Candidates by State
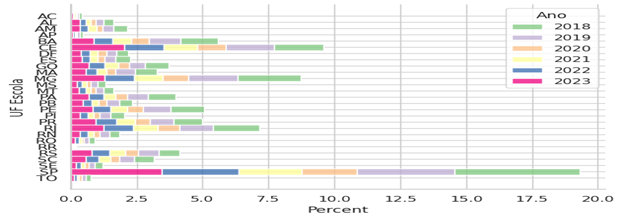
The states of São Paulo, Ceará, Rio de Janeiro, Minas Gerais, and Bahia have the largest number of registered candidates in the six exams. According to the 2022 Census Panorama (IBGE, 2023), the three most populous states in Brazil are the three in the Southeast region cited here, in the same order. The two from the Northeast region, Ceará, in eighth place, and Bahia, in fourth place, close the list that concentrates the largest volumes of registered candidates in the exams. Paraná, Rio Grande do Sul, and Pernambuco deviate from expectations because they have larger populations than Ceará, yet this is not reflected in the proportional volume of registrations.
In Figure 4, we present the distribution by state. The state of São Paulo corresponds to almost 20% of the total registered candidates, followed by Ceará with almost 10%. Minas Gerais, with more than 7.5%; Rio de Janeiro, with almost 7.5%; and Bahia, with more than 5%, close the five states with the most registered candidates. This distribution is slightly different from the population distribution, with a repositioning of Ceará, which is the eighth most populous state and the second in the number of registered candidates. There is an ongoing project in the state, already nationally recognized, to promote basic education and entry into higher education.
Candidates by State
A detailed view of the seven states with the largest number of candidates, in Figure 5, with a recompositing of the percentages for this extract. We observe that 2018 had the largest number of registered candidates. During the pandemic in 2020, the exam saw the lowest candidate participation due to the restrictive conditions of coexistence during the exam. Across the exams, the general ordering shows a change in 2018 and 2019, with the second position between Minas Gerais and Ceará. In 2021, the state of Paraná ranked sixth and, in the following years, moved to fifth place. The state of Ceará consolidates its position after 2020, with significant growth in the number of candidates.
Candidates in the Seven States with the Most Registered Candidates
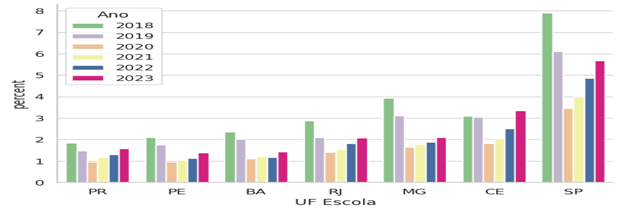
The impact of the pandemic was a drop of approximately 50% in the number of candidates in 2020. Taking the year 2018 as the one with the highest participation, when analyzing the last four states, we have a drop of approximately 50% of the candidates, when observing the first three, we have that in Minas Gerais and São Paulo, the drop was greater than 50% and Ceará was the only state that had a loss lower than this rate.
Age Group
The candidates for the exam are predominantly between 17 and 18 years old. As a natural consequence of completing basic education at 17 years old, more than 90% of candidates are in this age group. As shown in Figure 6, the summed percentages are close to the total number of candidates. In Figure 10, we find that the three age groups still have some expressive data; in the other age groups, there is a residual presence of candidates.
Candidates in the 17 and 18 Age Group 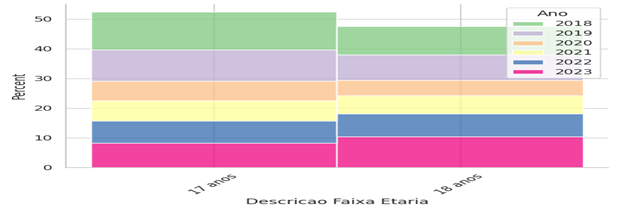
The exam is understood as a stage for the continuity of studies for recent high school graduates. The legislation designates ENEM as the main exam for entry into public universities through SISU, and as a mandatory requirement for access to student financing through FIES.
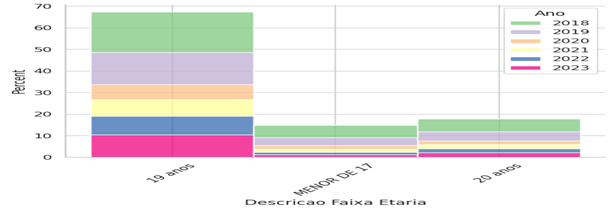
The candidates are mostly between 17 and 20 years old. In Figure 7, we complete the age distribution of the candidates, including the age groups of Under 17, 19, and 20 years old. This group represents 99.5% of the candidates.
Candidates from the Age Groups in Descending Order of Magnitude
School Management Type
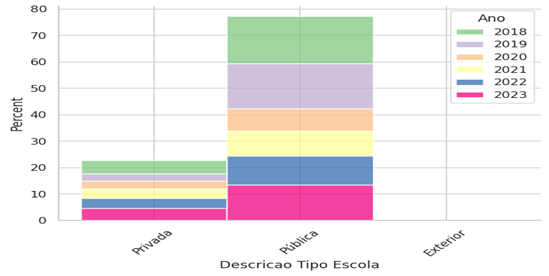
The distribution of School Management Type shows that the exam has greater participation from candidates in public schools. Figure 8 shows that almost 80% of the candidates come from public schools, and less than 20% from private schools. A detail observed is the presence of candidates from abroad who appeared only in 2018, due to the registration condition allowing students from outside the country who took the ENCCEJA 2017 and achieved proficiency in high school. Until 2020, this characteristic was still considered; it was removed from 2021 onwards. Considering the characterization, the candidates originate from public schools.
Percentage of Candidates by School Management Type
Color-Race
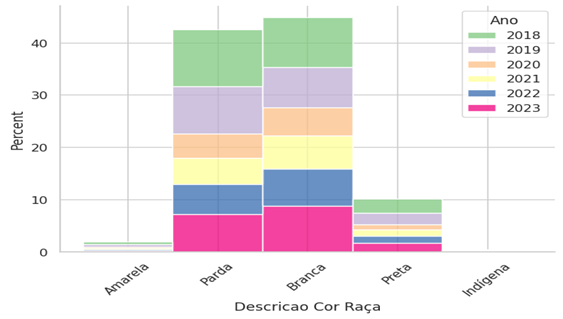
The distribution by color-race shows a predominance of White and Brown. Figure 9 shows that there is almost equal representation between the two races, with a significant number of Black people. There is a trace of the Yellow race and a residual record of the Indigenous race. The combination of the Brown and Black races presents the predominance reflected in the 2022 Census (IBGE, 2023). Thus, the candidates are predominantly White or Brown.
Percentage of Candidates by Color-Race
General Candidate Performance
The ENEM exams were held on two consecutive Sundays, with the exams organized on each day according to Table 6.
Distribution of Exams in ENEM
|
Day |
Knowledge Areas |
|
1st Day |
Languages and Codes and Technologies (LC) / Human Sciences and Technologies (CH) / Essay (RED) |
|
2nd Day |
Natural Sciences and Technologies (CN) / Mathematics and Technologies (MT) |
In the next sections, we will examine the performance of each exam across the knowledge areas. The Box Plot is a standardized graph used to display the data distribution based on the five-number summary:
· Minimum: Represents the lowest value, excluding outliers.
· First quartile: 25% of the data is below this value.
· Median: divides the box into two parts (second quartile).
· Third quartile: 75% data is below this value.
· Maximum: Represents the highest value.
Analysis of Languages and Codes
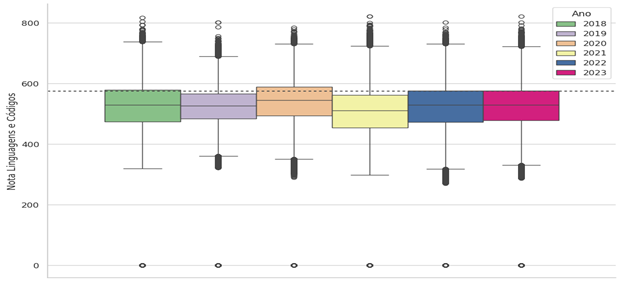
In Figure 10, we show the candidates' performance in the Languages and Codes area. The dotted line represents the third quartile score of the general performance, which is 574.10. In a first analysis, the results for 2020 and 2018 stand out positively compared to the other years, and the year 2021 showed the lowest performance. Looking at performance trends, we saw growth between 2018 and 2020, a sharp drop in 2021, and stability in 2022-2023 in the area. Thus, the year 2020 was the one with the best performance in languages and codes, and the worst result was in 20212020 was the best year for languages and codes, and 2021 was the worst.
Performance in Languages and Codes in the Exams
Foreign Language
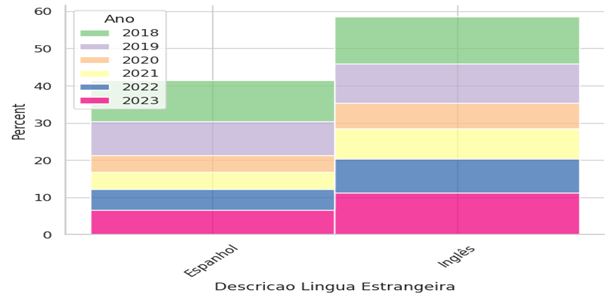
Regarding the choice of foreign language, Figure 11 shows that almost 60% of the candidates choose English, and more than 40% choose Spanish. Thus, the English exam is the preferred one of the exams.
Percentage of Foreign Language Choice
Analysis of Human Sciences and their Technologies
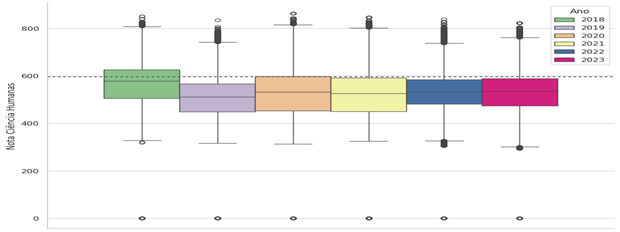
In Figure 12, we have the performance of the candidates in the Human Sciences area. The dotted line represents the third quartile score of the general performance, which is 596.70. The only standout year is 2018, which stands out in the trend analysis, as the other years show behavior closer to linearity. The worst year was 2019, and even then, it did not perform much worse than the other years. The year with the best performance in Human Sciences was 2018.
Performance in Human Sciences and their Technologies
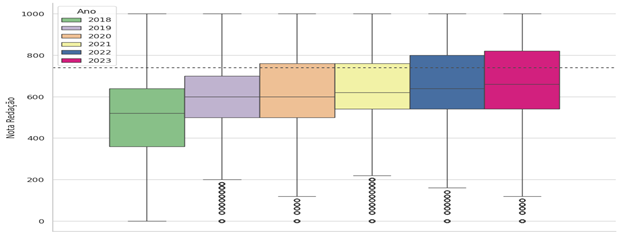
Essay Analysis
In Figure 13, we show the candidates' performance in the Essay. The dotted line represents the third quartile score of the general performance, which is 740.00. The clearest result is that performance has been evolving over the exams. After a significant jump in performance from 2018 to 2019, stability from 2019 to 2020, and growth in average performance from 2020 onwards. The best result occurred in 2023, and the worst in 2018. The year 2023 was the best result in the essay and the worst in 2018.
Essay Performance
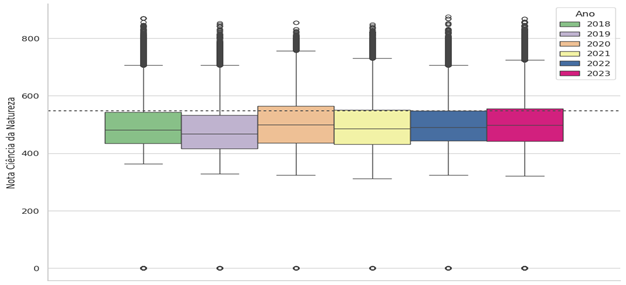
Analysis of Natural Sciences and their Technologies
In Figure 14, we show the candidates' performance in Natural Sciences. The dotted line represents the third quartile score of the general performance, which is 547.40. The year with the best performance was 2020. The area with the lowest performance shows an irregular cycle between 2018 and 2020, followed by growth between 2021 and 2023. The year with the worst performance was 2019. The year with the best performance in Natural Sciences was 2020.
Performance in Natural Sciences and their Technologies in the Exams
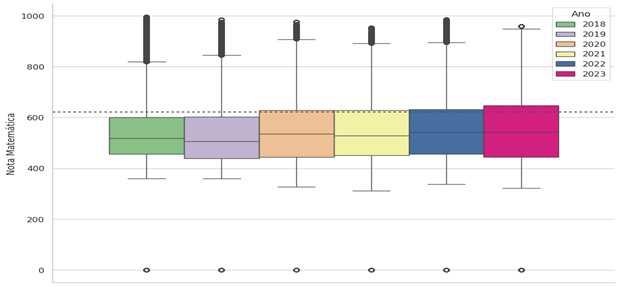
Analysis of Mathematics and its Technologies
In Figure 15, we show the candidates' performance in Mathematics. The dotted line represents the third quartile score of the general performance, which is 622.00. The global average of the exams improved, but without a regular growth pattern. The year 2019 had the worst performance, and 2023 the best. The year 2023 is the best performance in Mathematics.
Performance in Mathematics and its Technologies in the Exams
Considerations on General Performance
The general performance of the candidates has certain characteristics to consider. Regarding the impacts of the pandemic, 2020 was the most affected by the absence of candidates on exam days, and 2021 showed a greater impact on the results, with 279 days of school suspension (INEP, 2021).
The year 2018 stands out positively in the Human Sciences area, but it had the worst result in the essay. In 2019, the performance of Mathematics, Natural Sciences, and Human Sciences was the worst. The year 2020 was the one with the best performance in Languages and Codes and in Natural Sciences. The year 2021 was the worst result in Languages and Codes. The year 2023 was the best result in the essay and Mathematics.
Performance by Exam Year
In this part, we analyze each exam year, with an emphasis on the performance characteristics of the candidates. The procedures for this analysis are the comparison of statistical data with the overall exam results and the analysis of the candidate density curve by performance.
The statistical data found showed high variability. The standard deviation measures the dispersion of a sample, and in each exam, we had high values. In particular, the essay was the evaluation that showed the greatest deviations. Thus, these values serve as weak references as data concentrators, but they are important for comparing areas and exams.
2018
The 2018 exam had higher means in Human Sciences, Languages and Codes, and Natural Sciences than the general average; the 3rd quartile averages were higher in Human Sciences and Languages and Codes; and the maximum score in Mathematics was achieved in this exam. Table 7 shows the statistical data for the exam.
Statistics of the 2018 Exam
|
Knowledge Area |
M |
SD |
25% |
50% |
75% |
Max |
|
LC |
524.70 |
73.17 |
473.10 |
529.50 |
578.70 |
816.90 |
|
CH |
565.37 |
80.34 |
505.00 |
577.60 |
626.40 |
850.40 |
|
CN |
492.79 |
74.87 |
433.80 |
481.40 |
542.90 |
869.60 |
|
MT |
536.63 |
103.48 |
456.50 |
517.30 |
601.30 |
996.10 |
|
RED |
520.38 |
192.16 |
360.00 |
520.00 |
640.00 |
1000.00 |
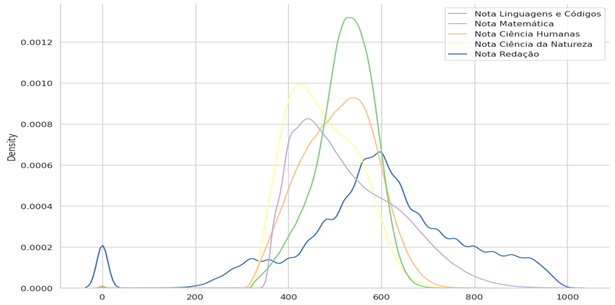
As the ratio of the standard deviation to the mean is between 13% and 20% for the knowledge areas and 37% for the essay, the data show high variability, especially in the essay. Due to this characteristic, we can observe the distribution of scores relative to the candidates’ exam scores in Figure 16.
Performance by Area in the Year 2018
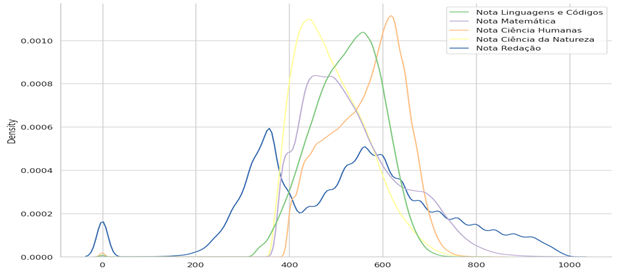
The Human Sciences scores had the highest density with scores close to 600 (six hundred) points; the Languages and Codes score had a density close to 600 (six hundred) points. The highest density in Mathematics is with a plateau between 450 (four hundred and fifty) and 550 (five hundred and fifty) points. Finally, the essay presents three highlights: the first with a zero score; the second, with the highest density, close to 400 (four hundred) points; and another peak close to 600 (six hundred) points. In Figure 16, a characteristic of this density distribution is that the order of general performance is Human Sciences, Languages, Mathematics, Natural Sci, and Essay.
2019
In the 2019 exam, the only maximum score was in the essay; no mean exceeded the general average of the series of exams under study. Comparing the knowledge areas, the means are in the following order: Essay, Math, Languages, Human Sciences, and Natural Sciences. Table 8 shows the statistical data for the exam.
Statistics of the 2019 Exam
|
Knowledge Area |
M |
SD |
25% |
50% |
75% |
Max |
|
LC |
520.57 |
63.48 |
483.30 |
526.50 |
565.50 |
801.70 |
|
CH |
507.89 |
80.17 |
449.20 |
511.50 |
566.30 |
835.10 |
|
CN |
475.51 |
75.58 |
415.20 |
467.70 |
531.60 |
853.50 |
|
MT |
527.23 |
108.95 |
439.70 |
505.90 |
601.80 |
985.50 |
|
RED |
589.15 |
188.87 |
500.00 |
600.00 |
700.00 |
1000.00 |
In the distribution of the third quartile, we have the following order: Essay, Mathematics, Human Sciences, Languages and Codes, and Natural Sciences.
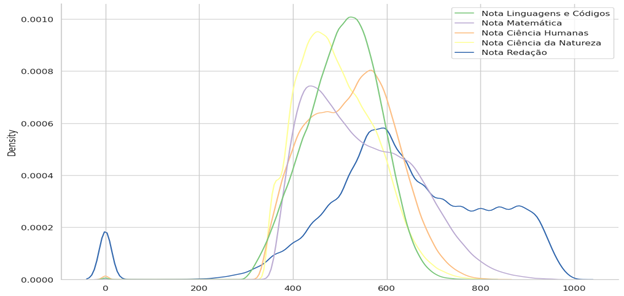
As the ratio of the standard deviation to the mean is between 12% and 21% for the knowledge areas and 32% for the essay, the data show high variability, especially in the essay. Due to this characteristic, we can observe the distribution of scores relative to the candidates’ exam scores in Figure 17.
Performance by Area in the Year 2019
The Languages and Codes scores had the highest density at 500 (five hundred) points, and the Natural Sciences score had a density close to 400 (four hundred) points. The third-highest density point is Human Sciences, with a score close to 550 (five hundred and fifty). The highest density in Mathematics is with a peak of 450 (four hundred and fifty) points. Finally, the essay presents two highlights: the first with a zero score and the second at 600 (six hundred) points. In Figure 20, a characteristic of this density distribution is that the order of general performance is: Essay, Human Sciences, Languages and Codes, Mathematics, Natural Sciences.
2020
In the 2020 exam, the maximum scores were reached in Essay and Human Sciences. The means for Languages and Codes, Mathematics, Essay, and Natural Sciences were higher than the general average. Table 9 shows the statistical data for the exam.
Statistics of the 2020 Exam
|
Knowledge Area |
M |
SD |
25% |
50% |
75% |
Max |
|
LC |
536.21 |
72.89 |
492.90 |
544.20 |
587.90 |
783.90 |
|
CH |
526.28 |
95.25 |
452.40 |
531.70 |
597.50 |
862.60 |
|
CN |
501.37 |
81.70 |
435.10 |
499.50 |
563.80 |
854.80 |
|
MT |
542.60 |
121.12 |
443.20 |
535.30 |
629.00 |
975.00 |
|
RED |
615.85 |
200.25 |
500.00 |
600.00 |
760.00 |
1000.00 |
In the distribution of the third quartile, we have the following order: Essay, Languages, Mathematics, Human Sci., and Natural Sci. In terms of maximum scores, the order is: Essay, Mathematics, Human Sci., Natural Sci., and Languages.
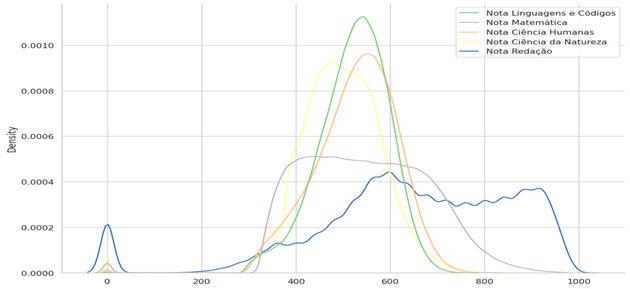
As the ratio of the standard deviation to the mean ranges from 13% to 23% for the knowledge areas and 33% for the essay, we observe high data variability, especially in the essay. Due to this characteristic, we can observe the distribution of scores relative to the candidates’ exam scores in Figure 18.
Performance by Area in the Year 2020

The Languages and Codes scores had the highest density, with scores at 550 (five hundred and fifty) points, while the Natural Sciences score had a density close to 450 (four hundred and fifty) points. The third-highest density point is Human Sciences, with a score close to 550 (five hundred and fifty). The highest density in Mathematics is close to 450 (four hundred and fifty) points. Finally, the essay presents two highlights: the first with a zero score and the second at 550 (five hundred and fifty) points. Still in Figure 18, a characteristic of this density distribution is the order of general performance.
2021
For 2021, the maximum score was reached in the Essay. The means for Mathematics, Essay, and Natural Sciences were higher than the general average. Comparing the knowledge areas, the means are in the following order: Essay, Mathematics, Human Sciences, Languages and Codes, and Natural Sciences. Table 10 shows the statistical data for the exam.
Statistics of the 2021 Exam
|
Knowledge Area |
M |
SD |
25% |
50% |
75% |
Max |
|
LC |
507.25 |
76.81 |
454.50 |
511.10 |
562.20 |
820.50 |
|
CH |
523.06 |
92.76 |
450.40 |
526.60 |
591.00 |
846.90 |
|
CN |
493.75 |
80.93 |
431.40 |
484.90 |
551.10 |
848.70 |
|
MT |
544.61 |
112.04 |
451.20 |
528.30 |
627.40 |
953.10 |
|
RED |
629.68 |
190.13 |
540.00 |
620.00 |
760.00 |
1000.00 |
In the distribution of the third quartile, we have the following order: Essay, Mathematics, Human Sciences, Languages and Codes, and Natural Sciences.
As the ratio of the standard deviation to the mean is between 15% and 21% for the knowledge areas and 30% for the essay, the data show high variability, especially in the essay. Due to this characteristic, we can observe the distribution of scores relative to the candidates’ exam scores in Figure 19.
Performance by Area in the Year 2021
The Languages and Codes scores had the highest density at 500 (five hundred) points, and the Natural Sciences score had a density close to 450 (four hundred and fifty) points. The third-highest density point is Human Sciences, with a score close to 550 (five hundred and fifty). The highest density in Mathematics is close to 450 (four hundred and fifty) points. Finally, the essay presents two highlights: the first with a zero score and the second at 600 (six hundred) points.
2022
For 2022, the maximum score was reached in the Essay and Natural Sciences. The means for Mathematics, Essay, and Natural Sciences were higher than the general average. Comparing the knowledge areas, the means are in the following order: Essay, Mathematics, Human Sciences, Languages and Codes, and Natural Sciences. Table 11 shows the statistical data for the exam.
Statistics of the 2022 Exam
|
Knowledge Area |
M |
SD |
25% |
50% |
75% |
Max |
|
LC |
507.25 |
76.81 |
454.50 |
511.10 |
562.20 |
820.50 |
|
CH |
523.06 |
92.76 |
450.40 |
526.60 |
591.00 |
846.90 |
|
CN |
493.75 |
80.93 |
431.40 |
484.90 |
551.10 |
848.70 |
|
MT |
544.61 |
112.04 |
451.20 |
528.30 |
627.40 |
953.10 |
|
RED |
629.68 |
190.13 |
540.00 |
620.00 |
760.00 |
1000.00 |
In the distribution of the third quartile, we have the following order: Essay, Mathematics, Human Sciences, Languages and Codes, and Natural Sciences.
As the ratio of the standard deviation to the mean is between 14% and 22% for the knowledge areas and 33% for the essay, we have a high variability of the data, especially in the essay. Due to this characteristic, we can observe the distribution of scores relative to the candidates’ exam scores in Figure 20.
Performance by Area in the Year 2022
The Languages and Codes scores had the highest density, at 550 (five hundred and fifty) points, and the Natural Sciences score had a density close to 500 (five hundred) points. The third-highest density point is Human Sciences, with a score close to 550 (five hundred and fifty). The highest density in Mathematics is close to 450 (four hundred and fifty) points. Finally, the essay presents two highlights: the first with a zero score and the second at 600 (six hundred) points.
2023
For 2023, the maximum score was reached in the Essay and Languages and Codes. The means for Mathematics, Languages and Codes, Essay, and Natural Sciences were higher than the general average. Comparing the knowledge areas, the means are in the following order: Essay, Mathematics, Human Sciences, Languages and Codes, and Natural Sciences. Table 12 shows the statistical data for the exam.
Statistics of the 2023 Exam
|
Knowledge Area |
M |
SD |
25% |
50% |
75% |
Max |
|
LC |
523.04 |
73.84 |
477.30 |
529.10 |
575.10 |
820.80 |
|
CH |
527.97 |
85.96 |
473.70 |
535.60 |
588.90 |
823.00 |
|
CN |
498.34 |
86.53 |
441.90 |
497.10 |
554.70 |
868.40 |
|
MT |
547.98 |
131.78 |
443.40 |
542.90 |
647.40 |
958.60 |
|
RED |
649.43 |
214.27 |
540.00 |
660.00 |
820.00 |
1000.00 |
In the distribution of the third quartile, we have the following order: Essay, Mathematics, Human Sciences, Languages and Codes, and Natural Sciences.
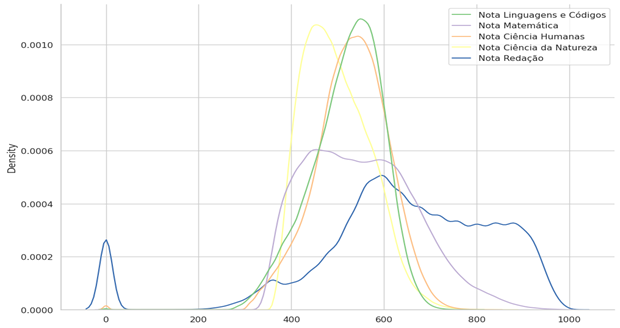
As the ratio of the standard deviation to the mean is between 14% and 24% for the knowledge areas and 33% for the essay, we have a high variability of the data, especially in the essay. Due to this characteristic, we can observe the distribution of scores relative to the candidates’ exam scores in Figure 21.
Performance by Area in the Year 2023
The Languages and Codes scores had the highest density at 500 (five hundred) points, and the Human Sciences score had a density close to 550 (five hundred and fifty) points. The third-highest density point is Natural Sciences, with a score close to 550 (five hundred and fifty). The highest density in Mathematics has a decreasing plateau starting near 400 (four hundred) points and ending near 700 (seven hundred) points. Finally, the essay presents three highlights: the first with a zero score, the second at 600 (six hundred) points, and the third close to 900 (nine hundred) points.
Conclusion
Scores are best in all measures (mean, 3rd quartile, and maximum) in all exams. The only exception was in 2018, when it ranked fourth. Unlike the analysis based on measures of central tendency, when performance was assessed using the highest-density concentrations of candidates, the behavior was the same, but in 2018, it ranked fifth.
The Mathematics scores rank second across all measures (mean, 3rd quartile, and maximum) on all exams. The exception occurs in the 3rd-quartile measure in 2018 and 2020, where it ranks third. Unlike the analysis based on measures of central tendency, performance by the highest-density concentrations of candidates was third in 2018, fourth in 2019, and fifth in 2020-2021-2022-2023.
The Natural Sciences scores rank 5th in the mean and 3rd quartile measures. The only exception is 2018, which had the highest score. In the maximum-scores measure, it ranks third, except in 2020. Unlike analyses based on measures of central tendency, performance by the highest-density concentrations of candidates ranked fourth in 2018-2020-2021-2022-2023 and fifth in 2019.
The Human Sciences scores exhibit different patterns across measures. Based on the mean, it ranked fourth in 2019-2020 and third in 2022-2023. In the 3rd Quartile measure, it was second in 2018, third in 2019-2021-2022-2023, and fourth in 2020. Unlike the analysis based on measures of central tendency, performance was highest among the highest-density concentrations of candidates: first in 2018, second in 2019-2021-2023, and third in 2020-2022.
The Languages and Codes scores exhibit different behavior across measures. In the mean, it ranked third in 2018-2019-2020 and fourth in 2021-2022-2023. In the 3rd-quartile measure, it ranked fourth in all years except 2020, when it ranked second. In terms of maximum scores, it ranks fifth in all years. Unlike the analysis based on measures of central tendency, the performance analysis based on the highest-density concentrations of candidates ranked second in 2018-2020-2022 and third in 2019-2021-2023.
References
BRASIL. (1996). Lei de Diretrizes e Bases da Educação Nacional – LDB, Lei n.º 9.394, de 20 de dezembro de 1996 [Law of Directives and Bases of National Education – LDB, Law No. 9.394, of December 20, 1996]. Presidência da República. http://www.planalto.gov.br/ccivil_03/leis/l9394.htm
BRASIL. (2017). Base Nacional Comum Curricular – BNCC [National Common Curricular Base – BNCC]. Ministério da Educação. http://basenacionalcomum.mec.gov.br/
BRASIL. (2023). Microdados do ENEM [ENEM Microdata]. Instituto Nacional de Estudos e Pesquisas Educacionais Anísio Teixeira – INEP. http://www.inep.gov.br/microdados
Freitas, L. C., & Sordi, M. R. L. (2021). Avaliação educacional: caminhando pela contra-mão [Educational evaluation: walking against the grain]. Vozes.
IBGE – Instituto Brasileiro de Geografia e Estatística. (2023). Panorama do Censo 2022 [2022 Census Panorama]. https://censo2022.ibge.gov.br/panorama/mapas.html?localidade=&recorte=N2
INEP – Instituto Nacional de Estudos e Pesquisas Educacionais Anísio Teixeira. (2021). Divulgados dados sobre impacto da pandemia na educação [Data released on the impact of the pandemic on education]. https://www.gov.br/inep/pt-br/assuntos/noticias/censo-escolar/divulgados-dados-sobre-impacto-da-pandemia-na-educacao
INEP – Instituto Nacional de Estudos e Pesquisas Educacionais Anísio Teixeira. (2024). Saiba mais sobre o panorama das mulheres na educação básica [Learn more about the panorama of women in basic education]. https://www.gov.br/inep/pt-br/assuntos/noticias/censo-escolar/saiba-mais-sobre-o-panorama-das-mulheres-na-educacao-basica
Luckesi, C. C. (2022). Avaliação em educação: questões epistemológicas e práticas [Evaluation in education: epistemological and practical issues]. Cortez Editora.
OPAS – Organização Pan-Americana da Saúde. (2024). Histórico da pandemia de COVID-19 [History of the COVID-19 pandemic]. https://www.paho.org/pt/covid19/historico-da-pandemia-covid-19
Schwartzman, S. (2011). As avaliações de nova geração nas sociedades contemporâneas [New generation evaluations in contemporary societies]. Fundação Getúlio Vargas.
TUFTE, E. R. (1983). The visual display of quantitative information. Graphics Press.
Page 1 of
Download Count : 4
Visit Count : 189
Keywords
ENEM (Exame Nacional do Ensino Médio); Educational Evaluation; Microdata Analysis; Higher Education Access; COVID-19 Impact
Author(s) Information


How to write this article
Pequeno, W. D. O, Orlandi, T. R. C., Cartaxo, M. A., & Santana, P. C. (2025). Identification of the profile of participants in the national university entrance exam in Brazil. Studies in Educational Management, 18, 13-36. https://doi.org/10.32038/sem.2025.18.02
Acknowledgments
Not applicable.
Funding
Not applicable.
Conflict of Interests
No, there are no conflicting interests.
Open Access
This article is licensed under a Creative Commons Attribution 4.0 International License, which permits use, sharing, adaptation, distribution and reproduction in any medium or format, as long as you give appropriate credit to the original author(s) and the source, provide a link to the Creative Commons license, and indicate if changes were made. You may view a copy of Creative Commons Attribution 4.0 International License here: http://creativecommons.org/licenses/by/4.0/