


Original Research
The Influence of User Readiness on Self Check-In Technology Adoption: A Study Using TRAM Method
- Abstract
- Full text
- Metrics
The innovative digital, which was introduced by an Indonesian cabin hotel firm to improve operational efficiency, Self Check-in Technology (SCT), became the object of this investigation. The objective of this numerical study is to achieve insight into elements influencing user readiness to embrace technology by utilizing the Technology Readiness Acceptance Model (TRAM). This research data was gathered by involving 430 participants who had stayed at a cabin hotel at least once using an online questionnaire. The gathered data underwent analysis through the SmartPLS application to process the measurement of the outer model, inner model, and hypotheses. The results indicate that 6 out of 11 hypotheses were validated. Optimism (OPT) substantially and favorably influences perceived ease of use (PEU) and perceived usefulness (PU), while innovativeness (INN) significantly only affects PU. However, Insecurity (INS) and discomfort (DIS) do not impact PEU and PU. PEU positively impacts PU, and both highly impact intention to use. This study concludes that the use intention of the SCT is driven by OPT, INN, INS, DIS, PEU, and PU. These findings support the adoption of the technology to enhance operational performance within the hospitality industry. A successful investigation is recommended for conducting usability testing to further evaluate user experience, as usability plays a critical role in affecting user-friendliness. Furthermore, it is essential to implement a data protection policy. Ultimately, the aim is to utilize the technology.
The Influence of User Readiness on Self Check-In Technology Adoption: A Study Using TRAM Method
Sarah Anindya Shofi , Astri Ghina
School of Economic and Business, Telkom University, Indonesia
Abstract:
The innovative digital, which was introduced by an Indonesian cabin hotel firm to improve operational efficiency, Self Check-in Technology (SCT), became the object of this investigation. The objective of this numerical study is to achieve insight into elements influencing user readiness to embrace technology by utilizing the Technology Readiness Acceptance Model (TRAM). This research data was gathered by involving 430 participants who had stayed at a cabin hotel at least once using an online questionnaire. The gathered data underwent analysis through the SmartPLS application to process the measurement of the outer model, inner model, and hypotheses. The results indicate that 6 out of 11 hypotheses were validated. Optimism (OPT) substantially and favorably influences perceived ease of use (PEU) and perceived usefulness (PU), while innovativeness (INN) significantly only affects PU. However, Insecurity (INS) and discomfort (DIS) do not impact PEU and PU. PEU positively impacts PU, and both highly impact intention to use. This study concludes that the use intention of the SCT is driven by OPT, INN, INS, DIS, PEU, and PU. These findings support the adoption of the technology to enhance operational performance within the hospitality industry. A successful investigation is recommended for conducting usability testing to further evaluate user experience, as usability plays a critical role in affecting user-friendliness. Furthermore, it is essential to implement a data protection policy. Ultimately, the aim is to utilize the technology.
Digital transformation can lack proper direction when there is no precise determination of strategy. Business leaders face challenges from competitors and require implementing a proper strategy for digital transformation in their business to enhance operational performance and stay ahead of the competition (Hess et al., 2016). The Indonesian Government has emphasized its determination to continue to elevate Indonesia to become one of the countries with a leading digital industrial ecosystem, hoping to realize Indonesia's vision as Asia's Digital Energy (Ghina & Afifah, 2021). An Indonesian cabin hotel firm aiming to improve its operational performance faces specific challenges. When visitors arrive at the location, they will check in, and staff will check the order by having visitors show their reservations that have been ordered and rechecking their data according to their identity card. Based on interviews with the company’s CTO, a key issue was identified in the lengthy durations and check-in process. Such a long process for visitors is, especially for those who make reservations through Online Travel Agent (OTA) Applications. Those who book through OTA Applications need to register by downloading the Cabin Hotel’s Application site. They can claim their reservations, and at the same time, another visitor can come to the location for a check. It will make the queue and the check-in process so long. In addition, the process of checking causes security issues due to possible identity theft during check-in. To address these challenges, the company is developing new technology—Self Check-in Technology—aimed at increasing staff efficiency and increasing the security of visitor’s data. Employees can then be reassigned to other tasks, such as upselling, cross-selling, and cleaning activities at each location, ultimately reducing routine expenses. From the visitors’ perspective, SCT can reduce the duration of the check-in process, leaving a positive impression. This technology, set to launch in 2024, will be a novel experience for visitors. However, for the technology to be effective in improving the check-in process, the company needs to assess users’ readiness for the technology. User readiness significantly impacts the effectiveness of check-in processes, even if the technology promises substantial advancements. Therefore, evaluating user readiness for the new technology is the objective of this research, which seeks to gain an understanding of the influence of intention to adopt SCT to ensure successful implementation.
Previous studies have highlighted that readiness and acceptance of technology influence the achievement of its implementation. According to Walczuch et al. (2007) highlighted the significance of personality traits in the processes of adopting technology and research by Mels, C. (2018, as cited in Saragih et al., 2020), a link exists between ‘readiness’ and the use or acceptance of technology, which makes readiness evaluation crucial in technology adoption. Besides readiness assessment, evaluating acceptance is also crucial for improving adoption rates. Taherdoost (2019, as cited in Saragih et al., 2020), noted that understanding users’ perceptions in adopting new technology supports further advancements in its implementation. In the scope of this research, evaluating user preparedness and acceptance of SCT is crucial for creating a more efficient and focused approach to its implementation. The research aims to investigate the effect of user readiness on adopting SCT using the TRAM.
Literature Review
Theoretical and Conceptual Background
The TRAM method combines dimensions from the Technology Readiness Index (TRI) with measurements of interpreted utility and simplicity of use from the Technology Acceptance Model (TAM). TRAM explains how these dimensions affect how individuals engage with, experience, and use novelty technology. In the study by Walczuch et al. (2007), technology readiness (TR) was employed as a forecaster in TAM to integrate both frameworks. The factors that constitute technology readiness were directly linked to TAM dimensions, leading to a more precise model. The TRAM model presented by Walczuch encompasses six variables or factors: INN, INS, OPT, DIS, PEU, and PU (Walczuch et al., 2007). Furthermore, in Lin et al.’s (2007) research, the intention to use was swayed by TR through the mediation of PEU and PU. Lin et al. (2007) introduced a slight variation by adding the variable use intention to the TRAM model so that it has seven variables. OPT is specified as a positive perspective and a conviction that technology can enhance performance in life, According to Parasuraman (2000, as cited in Godoe & Johansen, 2012). Additionally, OPT is characterized as a favorable viewpoint on technology and the conviction that it improves efficiency, adaptability, and control provided by technology (Nugroho & Andryzal Fajar, 2017). INN is described as the inclination to be the first or a trailblazer in embracing technology, according to Parasuraman (2000, as cited in Godoe & Johansen, 2012). INS is characterized as the uncertainties users have regarding the use of technology for information exchanges (Parasuraman, 2000, as cited in Godoe & Johansen, 2012). Parasuraman (2000, as cited in Godoe & Johansen, 2012) states that this DIS arises from the feeling of unease due to an absence of control over technology. PEU is the level at which individuals think that employing technology will be simple or easy (Davis, 1989). Rijatullah et al. (2020, as cited in Noviaristanti & Nugroho, 2024) state that it reduces the cognitive effort and time needed for obtaining and utilizing information systems. Meanwhile, the level people feel that utilizing technology will increase their performance is a definition of PU (Davis, 1989). Then, the degree to which individuals are willing to consistently make use of technology, confident that It is simple to operate and has demonstrated an ability to boost their productivity, is the definition of use intention (Lin et al., 2007).
Empirical Review and Hypothesis Development
According to Scheier and Carver (1985, as cited in Buyle et al., 2018), individuals who are optimistic generally expect positive outcomes rather than negative ones. OPT is associated with a hopeful view of technology and the belief that it will offer people greater effectiveness, adaptability, and regulation (Parasuraman, 2000). Furthermore, according to Hallikainen and Laukkanen (2016, as cited in Buyle et al., 2018), optimism positively influences PEU and PU of digital services within the B2B healthcare sector. Kuo et al. (2013) define optimism as a broad structure that captures a person’s emotions and shows that technology is beneficial (Nugroho & Andryzal Fajar, 2017). Optimism views technology as increasingly beneficial and simpler, with less concern for unfavorable results. Positive Technology Readiness (OPT) has a significant favorable effect on all cases of PEU (Oh et al., 2014). Optimism impacts use intention when the technology is perceived as user-friendly (Noviaristanti & Nugroho, 2024). In the research by Walczuch et al. (2007), it is proposed that optimism enables individuals to view technology as more beneficial and user-friendly since they worry less about possible adverse results. Garcia and Calantone (2002) said that INN is typically utilized to appraise the novelty pertaining to innovation, with innovative offerings being the high level of novelty. People labeled as ‘innovative’ adopt new concepts more quickly than others (Buyle et al., 2018). Parasuraman (2000) discussed the aspect of technology, characterizing it as “the tendency to be a leader and shaper in technology”. According to Venkatesh and Bala (2012, as cited in Buyle et al., 2018), It is possible to have a straightforward affirmative correlation between technology readiness and acceptance of standards for business processes. The presence of positive technology readiness (innovativeness) significantly enhances all instances of PEU (Oh et al., 2014).
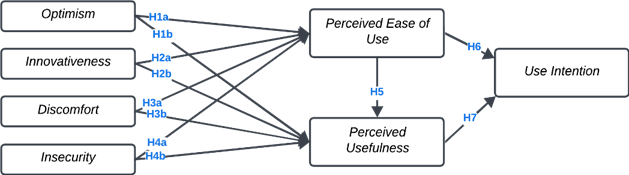
H1a: OPT has a significant positive influence on PEU when using SCT.
H1b: OPT has a significant positive influence on PU when using SCT.
H2a: INN has a significant effect on PEU when using SCT.
H2b: INN has a significant effect on PU when using SCT
Discomfort is described as the feeling of having insufficient control over technology and emotions swamped using it (Parasuraman, 2000). Mukherjee and Hoyer (2001, as cited in Buyle et al., 2018), state that the intricate features in technological products adversely affect product assessment because of the learning expenses incurred by users. Godoe and Johansen (2012) and Walczuch et al. (2007) state that DIS has demonstrated a disadvantageous effect on PEU and PU. Negative technology readiness (discomfort) significantly adversely affects PEU (Oh et al., 2014). INS indicates the confidence deficit in technology and uncertainty regarding its ability to operate efficiently (Parasuraman, 2000). According to Walczuch et al. (2007, as cited in Buyle et al., 2018), Oh et al. (2014), and Godoe and Johansen (2012), insecurity has a negative impact on PEU and PU.
H3a: DIS has a significant negative influence on PEU when using SCT.
H3b: DIS has a significant negative influence on PU when using SCT.
H4a: INS has a significant negative influence on PEU when using SCT.
H4b: INS has a significant negative influence on PU when using SCT.
Ramayah and Ignatius (2005) stated that PEU and PU are interconnected since the suggestion is that a user finding the data standard “user-friendly” is more likely to regard it as advantageous (Buyle et al., 2018). Moreover, PEU affects PU, indicating that a data standard regarded as user-friendly is viewed as more beneficial (Kuo et al., 2013). It was indicated that the TAM simplicity, value, and enjoyment drive the motivation to utilize (Chen et al., 2002; Davis et al., 1989; Koufaris, 2002; Lin et al., 2007; Oh et al., 2014; Straub et al., 1995; Szajna, 1996). indicate that users’ plans to return to shopping malls are influenced by perceived usefulness. Research by Moon and Kim (2001, as cited in Oh et al., 2014) shows that enjoyment, acting as a direct motivational element, affects the desire to embrace new technology more profoundly than usefulness, which serves as an external motivational element.
H5: PEU has a significant effect on PU when using SCT.
H6: PU has a significant effect on UI when using SCT.
H7: PEU has a significant positive influence on UI when using SCT.
All hypotheses and the model of the study are presented in Figure 1.
Figure 1
The Model of the Study and Hypothesis
Method
The initial action for this quantitative research taken by the researcher was recognizing the occurrence of digital transformation in the check-in procedure within the hospitality sector. Subsequently, the researcher determined the research object, namely an Indonesian cabin hotel firm.
Procedure
In this study, the first stage carried out by the researcher was to identify the phenomenon of digital transformation in check-in in the hotel industry. Then, the researcher determined the object of research, namely SCT. Then, the researcher formulated the problem and objectives to be achieved in this study. After that, the researcher compiled a research framework and relevant theories to answer the problem formulation. The researcher used the TRAM theory and formulated a hypothesis that was tested for its truth. Then, the researcher determined the population and sample in this study and compiled a research instrument by conducting validity and reliability tests. Furthermore, the researcher will distribute questionnaires to the respondents. The researcher will process data from the respondent's answer data that has been collected. After that, the researcher analyzes the data and interprets the research results by presenting the data in tabular form. In the final stage, the researcher will draw conclusions from the findings and provide suggestions for the company.
Measurement and Sample Size
As part of this research, the investigator utilizes Simple Random Sampling. Every item in the population is considered, and each item has an equal opportunity for selection as a subject in simple random sampling (Sekaran & Roger, 2016). The sample selection in this research employs Slovin’s Equation. Using the calculation with Slovin’s Equation, this research requires a minimum of 400 participants who have visited a cabin hotel at least once.
Partial Least Square– Structural Equation Modeling (PLS-SEM) was used in this study to analyze variables and test the model (Saragih et al., 2020). PLS-based SEM is an option for covariance-based SEM (CBSEM), and SEM-PLS is less strict in its rules compared to CBSEM (Narimawati et al., 2020). SEM-PLS is divided into two models, namely, the Inner Model and the Outer Model. According to Yamin and Kurniawan (2009, as cited in Hutami et al., 2022), the inner model is used to determine the relationship between latent variables or constructs and other latent variables or constructs. According to Hair et al. (2010, as cited in Hutami et al., 2022), Outer is used to determine the relationship between latent variables or constructs with their indicators.
The Smart PLS application is utilized for evaluating the outer model that is assessed through the evaluation of reliability and validity (CV or Convergent Validity and DV or Discriminant Validity) and also the inner model that is tested through the R, Q, and F square. Afterward, a hypothesis examination is conducted. Reliability testing involves the level of trustworthiness, consistency, dependability, and stability of measurement results (Indrawati, 2015). Convergent validity, which is essential for evaluation, can be determined by analyzing the loading factor values of indicators associated with a variable. The higher the loading factor value, the stronger the relationship of the indicator. Discriminant validity is used to show that indicators in a construct have higher values compared to similar constructs. According to Churchill and Lacobucci (2005), Hair et al. (2010), and Indrawati (2012), as cited in Indrawati (2015), a construct or variable is truly different from other constructs or variables. R square analysis is used to measure the magnitude of the ability of the independent variables used in research to explain the dependent variables (Ghozali, 2018). Based on the F square value, the magnitude of the influence of a variable on other variables or exogenous constructs on endogenous constructs can be determined with values of .02 (small impact), .15 (moderate impact), and .35 (large impact), respectively (Hair et al., 2014). The closer the predicted value is to the actual value, the higher the Q-square value indicates a high model accuracy level (Hair et al., 2014).
Operational Variables and Survey
The operational variables for this research are the initial part of creating questionnaire items so that each concept is described as functioning properly. The questionnaire items in this study use statements from previous research (Buyle et al., 2018; Kampa, 2023; Parasuraman, 2000; Parasuraman & Colby, 2015; Silva et al., 2022). Table 1 presents the questionnaire for this research.
The Operational Variables
|
Indicators |
Item & Statements |
|
OPT |
|
|
The technology’s contribution for the quality working |
OPT1) The apply of Self Check-in Technology contributes to better quality of my check-ins |
|
Ease of mobility |
OPT2) The use of Self Check-in Technology is swift in processing my check-in |
|
Control work with technology |
OPT3) Self Check-in technology is able to manage the information I provide when checking in |
|
Efficiency |
OPT4) Using Self Check-in Technology helps me shorten the time in the check-in process without having to queue at the receptionist. |
|
INN |
|
|
Ability to explain technology |
INN1) I can explain the use of Self Check-in Technology to others when asking for my help |
|
Mastery of the use of technology |
INN2) I can master the use of Self Check-in Technology |
|
Independent use of technology |
INN3) I can use Self Check-in Technology without help from others |
|
Keeping up with developments |
INN4) I know that Self Check-in Technology is starting to be widely used in accommodation |
|
DIS |
|
|
Doubt when facing technology problems |
DIS1) I’m worried that when I use Self Check-in Technology, verification will fail, causing me to have to check in manually. |
|
Doubts about technical support for using technology |
DIS2) Self Check-in technology displays how to use it in terms that are difficult to understand |
|
Lack of confidence in using technology |
DIS3) I would like to still have a receptionist help me use the Self Check-in Technology because I am not confident using the technology |
|
Lack of understanding of the technical instructions for use |
DIS4) There is no guide in simple language or language that is easy to understand when using Self Check-in Technology |
|
INS |
|
|
Dependence on technology |
INS1) I rely too much on Self Check-in Technology in the check-in process |
|
Perception of the dangers of using technology |
INS2) I am apprehensive about the information that I provide for Self Check-in Technology because it has the potential to be misused by other parties |
|
Perception of direct interaction |
INS3) When I check in, I prefer to interact with the receptionist rather than with the Self Check-in Technology |
|
Confidence in using online technology |
INS4) I feel unsure about carrying out the check-in process using Self Check-in Technology |
|
PU |
|
|
Speed of work |
PU1) In my opinion, Self Check-in Technology processes check-ins faster than processing them manually by the receptionist |
|
Job performance |
PU2) In my opinion, Self Check-in Technology improves my performance when processing check-ins |
|
Increased productivity |
PU3) Self Check-in technology speeds up the check-in process so I can immediately go to my room to carry out other agendas or rest. |
|
Job effectiveness |
PU4) In my opinion, Self Check-in Technology increases the effectiveness of checking in |
|
Ease of work |
PU5) In my opinion, Self Check-in Technology makes it easier for me to process check-ins |
|
Benefit assessment |
PU6) In my opinion, Overall Self Check-in Technology is useful and useful
|
|
PEU |
|
|
Technology is easy to learn |
PEU1) In my opinion, Self Check-in Technology is easy to learn for the first time I use it |
|
Easy to control technology |
PEU2) Self Check-in Technology has a display that makes it easier for me when I have an error in entering information or returning to the previous page. |
|
Clear and easy to understand |
PEU3) In my opinion, Self Check-in Technology is clear and easy to understand how to operate |
|
Flexibility |
PEU4) I can use Self Check-in Technology at any time (without time limit) |
|
Makes work easier |
PEU5) I found it easy to operate the SCT |
|
Ease assessment |
PEU6) In my opinion, Overall SCT is simple to utilize |
|
UI |
|
|
Keen on utilizing |
UI1) In times to come, I will SCT more often rather than meeting the receptionist to check in |
|
Interest in system development |
UI2) I am interested in developments or updates to SCT |
The participants will read the statements in the online survey and reply by selecting one of the choices. The answers to each item in the Likert scale have a gradient from the most positive to the most negative (Sugiyono, 2013). In this study, which uses a quantitative approach, scores are required for each answer. The Likert scale used in this study has 4 (four) options, from one for Strongly Disagree (SD) to four for Strongly Agree (SA), referring to the research of Susanty (2001) and Susanty and Wood (2011) as cited in Indrawati (2015) and (Rofadaliny, 2022). The Neutral point is not used to avoid social desirability bias, which is the tendency of respondents to respond in a manner that will satisfy the interviewer or be viewed as socially acceptable (Garland, 1991). The higher the validity of a measurement Instrument, the more accurately it achieves its intended purpose or precisely measures the desired attribute (Indrawati, 2015).
Findings
Respondents were collected over five months. Respondents in the study were all visitors who had visited at least once. Respondent data was obtained using questionnaires distributed online, both from social media and through communities. Table 2 presents the demographic information of respondents.
Demography
|
|
Option |
Frequency |
Percent (%) |
|
Gender |
Female |
237 |
55.12 |
|
Male |
193 |
44.88 |
|
|
Age |
17-25 |
185 |
43.02 |
|
26-35 |
228 |
53.02 |
|
|
36-45 |
16 |
3.72 |
|
|
46-55 |
1 |
0.23 |
|
|
Over 55 |
0 |
0
|
|
|
|
Option |
Frequency |
Percent (%) |
|
Graduate |
Elementary – Intermediate |
0 |
0 |
|
High |
100 |
23.26 |
|
|
Diplomat 1 – 3 |
41 |
9.53 |
|
|
Diplomat 4 / Bachelor |
256 |
59.53 |
|
|
Master |
33 |
7.67 |
|
|
Doctor |
0 |
0 |
|
|
Visit |
1 time visit |
233 |
54.19 |
|
Visit every month Regularly |
58 |
13.49 |
|
|
at least once every 1-6 months Regularly |
94 |
21.86 |
|
|
at least once every 7-12 months |
45 |
10.47 |
|
|
Last Visit (month(s) ago) |
< 1 |
102 |
23.72 |
|
1-6 |
190 |
44.19 |
|
|
7-12 |
68 |
15.81 |
|
|
> 12 |
70 |
16.28 |
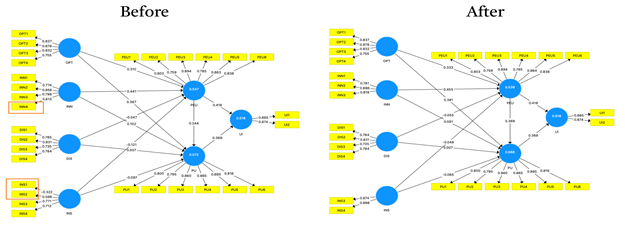
Figure 2 displays the outcome of the tests performed utilizing SmartPLSV3. Convergent validity, which is part of evaluating the validity, can be assessed by examining the loading factor values of indicators within a variable. The higher the loading factor value, the stronger the association of the indicator. Based on research Barclay et al. (1995, as cited in Santosa, 2018), the least outer loading value for an indicator is .70. Additionally, Indrawati (2015) and Ghozali (2021) state that an individual indicator is deemed dependable if it possesses a correlation value exceeding .70. In Figure 2, it is shown that the indicator items INN4 (.61), INS1 (-.32), and INS2 (.59) have values below .70. Therefore, these indicators must be eliminated from the model, and the SEM modeling process must be repeated. The latest model results after eliminating these three indicators are presented in Figure 2. After removing the three indicator items, the values of all indicator items are above .70 so that the variable is declared valid. In addition, convergent validity testing might also be assessed by the value of AVE that has a value higher than .50, it indicates that it has adequate CV according to Hair et al. (2010) and Ghozali (2008) as cited in Indrawati, 2015) and Hair et al. (2011, as cited in Hendayani & Febrianta, 2020).
Figure 2
Before and After Elimination
The variables with an AVE value of more than .50 indicate that variables in this model encounter CV in Table 3. The reliability examination of the measurement model can be viewed through Cronbach’s alpha and composite reliability, which have a score higher than .70, according to Hair et al. (2010, as cited in Hendayani & Febrianta, 2020). These findings show that each variable has values higher than .70 for both of them in Table 3.
AVE & Reliability Test
|
Variable |
AVE (>.5) |
Cron. alpha (>.7) |
Comp. reliability (rho_a) (>.7) |
Comp. reliability (rho_c) (>.7) |
|
DIS |
.61 |
.79 |
.80 |
.86 |
|
INN |
.68 |
.77 |
.78 |
.86 |
|
INS |
.78 |
.72 |
.73 |
.88 |
|
OPT |
.68 |
.84 |
.84 |
.89 |
|
PEU |
.68 |
.90 |
.91 |
.92 |
|
PU |
.70 |
.91 |
.91 |
.93 |
|
UI |
.77 |
.70 |
.70 |
.87 |
R square (R²) analysis assesses the degree to which the model used in the research can account for the dependent variable (Ghozali, 2018). R2 examination can be observed from R² value that has a value between 0 – 1. The greater or closer to 1 means that the prediction accuracy is greater. However, based on a study by Cohen (1988, as cited in Santosa, 2018), an R2 value of .25 or greater shows a significant impact. All variables in Table 4 have an R2 higher than .25, indicating that impact significantly for PEU, PU, and UI. Q square (Q²) analysis describes the predictability of the quality of the resulting value. Q² analysis can be measured from the R² value; when higher than 0, it indicates that the framework possesses predictive relevance. The Q² for the PEU (.36 or 36.3%), while PU (.39 or 39%), and UI (.394 equivalent to 39.4%) that it can be deduced that the variables PEU, PU, and UI possess predictive relevance value in Table 4.
R2 & Q2 Results
|
Variables |
R² |
R² Adjusted |
Q² predict |
|
PEU |
.53 |
.53 |
.36 |
|
PU |
.56 |
.56 |
.39 |
|
UI |
.51 |
.51 |
.39 |
The F2 value is separated inside three classifications: major (> .35), medium (> .15), and minor (> .02) (Santosa, 2018). According to Table 5, The influence of INN (.28) and OPT (.15) on PEU is moderate in F2 values. Moreover, the impact of OPT (.18) on PU exhibits a moderate effect. The impact of PEU (.19) and PU (.15) on UI shows a moderate effect.
F2 Results
|
Variables |
PEU |
PU |
UI |
|
DIS |
.00 |
|
|
|
DIS |
|
.00 |
|
|
INN |
.28 |
|
|
|
INN |
|
.00 |
|
|
INS |
.00 |
|
|
|
INS |
|
.00 |
|
|
OPT |
.15 |
|
|
|
OPT |
|
.18 |
|
|
PEU |
|
.14 |
|
|
PEU |
|
|
.19 |
|
PU |
|
|
.15 |
Hypothesis calibration is performed to ensure that they have a sway regardless of the independent variables. A hypothesis is defined as a temporary answer or result proposed to answer a predetermined issue definition, where the validity of the hypothesis needs to be tested and demonstrated using all collected data (Santosa, 2018). As presented in Table 6, if the T statistic is higher than or equal to the T-table (1.96) (with alpha equal to 5%), the hypothesis is supported (Ghozali, 2021).
Hypothesis Test
|
Hypotheses |
β |
t (>1.96) |
p (<.05) |
Status |
|
|
1a |
OPT_ -> PEU |
.33 |
6.70 |
.000 |
Supported |
|
1b |
OPT_ -> PU |
.38 |
6.71 |
.000 |
Supported |
|
2a |
INN_ -> PEU |
.45 |
1.48 |
.000 |
Supported |
|
2b |
INN_ -> PU |
.08 |
1.51 |
.066 |
Not Supported |
|
3a |
DIS -> PEU |
-.05 |
1.57 |
.058 |
Not Supported |
|
3b |
DIS -> PU |
.00 |
0.16 |
.436 |
Not Supported |
|
4a |
INS -> PEU |
-.04 |
1.20 |
.115 |
Not Supported |
|
4b |
INS -> PU |
-.06 |
1.48 |
.069 |
Not Supported |
|
5 |
PEU -> PU |
.36 |
6.26 |
.000 |
Supported |
|
6 |
PU -> UI_ |
.36 |
6.11 |
.000 |
Supported |
|
7 |
PEU -> UI_ |
.41 |
7.28 |
.000 |
Supported |
Discussion
Demographics indicate that women represent the largest portion of respondents regarding gender attributes. This relates to earlier studies indicating that women exhibit greater interest in embracing new technologies, particularly those connected to social communication and tools that assist in everyday living. Women tend to embrace technology viewed as simpler to use and more applicable to their daily lives (Venkatesh et al., 2000). Women who possess elevated education levels are more likely to embrace new technology swiftly, particularly in using tech devices for their education and professional purposes. Pertinent to the study’s results indicate that women with increased access to technological education are more receptive to embracing technological advancements (Venkatesh et al., 2003).
The demographic characteristics by age show that the largest group of respondents falls within the 26–35-year range, which is part of the Millennial Generation and Generation Z. They have a high intensity in using new technology. This is related to the fintech case study research, which states that Millennial and Z Generations have an intensity of use of new technology highly (Daqar et al., 2020). Gen Millennials and Gen Z have a high tendency to use technology that enables fast and efficient processes (Arner, Barberis, & Buckley, 2016 as cited in Daqar et al., 2020; Kim et al., 2021; Lee & Leonas, 2021; Rosli et al., 2023). The bachelor’s degree education level is the highest percentage compared to other education levels. In addition, respondents with a bachelor’s degree tend to be quicker in adopting self-service shopping technology (Duarte et al., 2022; Lee & Leonas, 2021); SCT at airports (Kusumah et al., 2021), and SCT in restaurants (Na et al., 2021).
Hypothesis H1a’s T statistic value is used to measure how much influence the OPT variable has on PEU, which indicates that the influence of OPT on PEU is strong. The results indicate that users hold a favorable opinion of SCT, which greatly influences its ease of use. It is aligned with previous research results, particularly those of (Aripradono, 2021; Hermanto et al., 2023; Kampa, 2023; Kuo et al., 2013; Noviaristanti & Nugroho, 2024; Yusuf et al., 2021; Walczuch et al., 2007).
Hypothesis H1b’s T-statistic value and p-value are 6.71 and 0, which signifies that the connection between OPT and PU is significant. This result corresponds with the outcomes of earlier research (Hermanto et al., 2023; Kampa, 2023; Kuo et al., 2013; Saragih et al., 2020; Walczuch et al., 2007; Yahya et al., 2024). It is indicated that can be drawn from these results is that there is a positive view of users towards SCT, which influences the usefulness of using the technology.
T-statistic value and p-value of H2a are 10.48 and 0, which shows that the influence of INN on PEU is strong. The P-value is 0, which shows that INN has a significant relationship with PEU significantly. This finding has the same results as previous studies (Aripradono, 2021; Buyle et al., 2018; Hermanto et al., 2023; Kampa, 2023; Kuo et al., 2013; Walczuch et al., 2007; Yusuf et al., 2021) which indicated that users are inclined to be the initial adopters (pioneers) of Selfi Check-in technology, impacting its usability.
Hypothesis H2b’s Tstatistic value of 1,512 is less than the T-table value. That Pvalue surpasses .05, suggesting that the relationship between INN and PU shows no effect. The tendency of users to be the first users (pioneers) of SCT does not affect the usefulness of using the technology, which aligns with previous studies (Aripradono, 2021; Kampa, 2023; Kuo et al., 2013; Yusuf et al., 2021).
In testing, H3a produced a T-statistic value of 1.57, which is lower than the T-table with a p-value of more than the value of .05. It shows that there is no relationship between DIS and influencing PEU. This discovery aligns with the outcomes of earlier studies (Aripradono, 2021; Buyle et al., 2018; Saragih et al., 2020), which stated that DIS does not affect PEU. The conclusion that can be drawn from these results is that users still feel that they do not need excessive effort to use SCT even if the user is uncomfortable.
Hypothesis H3b produced a p-value of .43, which exceeds .05, demonstrating that DIS does not affect PU. Then, the T-statistic value .16 indicated there is no relationship between DIS and PU. This result aligns with earlier studies (Kampa, 2023; Kuo et al., 2013; Saragih et al., 2020; Yusuf et al., 2021). It indicated that the discomfort experienced by users still feels the advantages of SCT even though they feel uncomfortable (Yusuf et al., 2021).
H4a’s T-statistic (1.2) is less than 1.96, which shows that it does not have the influence of INS on PEU. The H4a’s p-value exceeds .05, which means that the relationship between INS and PEU is not significant. This finding is in accordance with the data from earlier investigations (Buyle et al., 2018; Kampa, 2023; Saragih et al., 2020; Yusuf et al., 2021), which mentioned that INS does not affect PEU. The conclusion drawn from these results is that users can still feel the ease of using SCT because, for example, the technology is familiar or easy to use even though it is considered less safe (Yusuf et al., 2021).
Hypothesis H4b also has 1.48 for the T-statistic value and .06 for p-value. T statistic 1.48 is lower than the T-table (1.96), which shows that INS does not have an influence on PU. In the meantime, the p-value stands at .06, being greater than .05, indicating that there is no relationship between INS and PU. This result aligns with earlier research (Buyle et al., 2018; Kampa, 2023; Kuo et al., 2013; Saragih et al., 2020), which indicates that the user still feels the benefits of SCT even though feeling’s user is not secure.
Hypothesis H5 produced 6.26 for the T-statistic and 0 for the p-value. It suggests that the impact of PEU on PU is significant. The earlier research that aligns with this finding that can be drawn from this procuration is that PEU of SCT has affected the overall practical benefit of the technology for users (Aripradono, 2021; Buyle et al., 2018; Kampa, 2023; Kuo et al., 2013; Peng & Yan, 2022; Walczuch et al., 2007)
Hypothesis H6 produced 6.11 for T-statistic and 0 for the p-value, indicating the significant connection between PU and UT. This finding indicated that Perceived Usefulness influences Use Intention, which aligns with the research (Afiana et al., 2022; Aripradono, 2021; Hermanto et al., 2023; Kampa, 2023; Kuo et al., 2013; Peng & Yan, 2022). The inference that can be made from these findings is that the effectiveness of SCT greatly influences the intention to adopt it.
Hypothesis H7 shows that the relationship between PEU and UI is significant. This discovery aligns with the outcomes of earlier research (Afiana et al., 2022; Aripradono, 2021; Buyle et al., 2018; Hermanto et al., 2023; Kuo et al., 2013), which indicated that the user-friendliness of SCT has a considerable effect use intention of the technology. So, five out (H2b, H3a, H3b, H4a, and H4b) of 11 hypotheses were rejected.
The summary of findings and discussions regarding the acceptance of the SCT is six out of 11 hypotheses were supported. Respondents with demographics dominated by women, bachelor’s degree holders, and a visit frequency of 1-3 times at the venue tend to have sustainable use intention toward the SCT. The outer model test was successfully carried out, and this model can be said to be valid and reliable. In addition, the inner model was also successfully carried out so that this study can determine the influence between variables and meet the requirements of the R2, F2, Q2 test.
Conclusion
The conclusions of this research regarding the respondents with demographics dominated by women, bachelor’s degree holders, and a visit frequency of 1-3 times at venue tend. Only the variables Optimism and innovativeness have a significant positive effect on the variable perceived ease of use and only the variables Optimism and perceived ease of use have a positive and significant effect on perceived usefulness. The variables Perceived ease of use and perceived usefulness have a significant positive effect on Use Intention on Self Check-in Technology. This is evident from the hypothesis testing and all variables or constructs in the convergent validity and discriminant validity tests which are concluded to be valid.
Suggestion for Firm and Future Research
Suggestions for companies in developing Self Check-in Technology can create a simple flow so that users can be sure that this technology is felt to provide benefits or uses in the check-in process, increase efficiency, and is considered easy to use. In addition, an interesting advertising or socialization program on social media, websites, and hotel company applications related to Self Check-in Technology has been launched in the hotel lobby to attract visitors, especially first-time visitors, and use this technology to increase the desire to try new technology before others.
This research is surveyed using only one brand of cabin hotel and a quantitative approach. It recommended that upcoming research conduct usability tests with general visitor’s cabin hotel. It uses a qualitative approach to evaluate user experience better. Good usability values will impact the visitor's increased efficiency and productivity. Increasing efficiency and productivity can increase users' optimism, which can then be enhanced to sustain and enhance perceived ease of use and intention.
References
Afiana, F. N., Karomatunnisa, H., & Sekar, A. (2022). Integrasi Technology Readiness dan Technology Acceptance Model untuk analisis kesiapan pengguna terhadap penerimaan Aplikasi Parenting [Integration of Technology Readiness and Technology Acceptance Model for analysis of user readiness towards acceptance of Parenting Applications]. Edu Komputika Journal, 9(2), 122–133. https://doi.org/10.15294/edukomputika.v9i2.61537
Aripradono, H. W. (2021). Analysis of technology readiness and acceptance models for sport wearable technology. Teknika, 10(1), 68–77. https://doi.org/10.34148/teknika.v10i1.330
Buyle, R., Van Compernolle, M., Vlassenroot, E., Vanlishout, Z., Mechant, P., & Mannens, E. (2018). “Technology readiness and acceptance model” as a predictor for the use intention of data standards in smart cities. Media and Communication, 6(4Theoretical Reflections and Case Studies), 127–139. https://doi.org/10.17645/mac.v6i4.1679
Chen, L., Gillenson, M., & Sherell, L. (2002). Enticing online consumers: an extended technology acceptance perspective. Information & Management, 39(2), 705–719. https://doi.org/10.1016/S0378-7206(01)00127-6
Daqar, M., Arqawi, S., & Karsh, S. A. (2020). Fintech in the eyes of Millennials and Generation Z (the financial behavior and Fintech perception). Banks and Bank Systems, 15(3), 20–28. https://doi.org/10.21511/bbs.15(3).2020.03
Davis, F. (1989). Perceived usefulness, perceived ease of use, and user acceptance of information technology. MIS Quarterly, 13(3). https://doi.org/10.2307/249008
Duarte, P., Silva, S. C., Linardi, M. A., & Novais, B. (2022). Understanding the implementation of retail self-service check-out technologies using necessary condition analysis. International Journal of Retail and Distribution Management, 50(13), 140–163. https://doi.org/10.1108/IJRDM-05-2022-0164
Garcia, R., & Calantone, R. (2002). A critical look at technological innovation typology and innovativeness terminology: A literature review. Journal of Product Innovation Management, 19(2), 110–132. https://doi.org/10.1111/1540-5885.1920110
Garland, R. (1991). The mid-point on a rating scale: Is it desirable? Marketing Bulletin, 2. http://marketing-bulletin.massey.ac.nz
Ghina, A., & Afifah, N. (2021). Value proposition design for custom clothing startup using design thinking approach. Jurnal Manajemen Indonesia, 21(1), 89. https://doi.org/10.25124/jmi.v21i1.3523
Ghozali, I. (2018). Aplikasi analisis multivariate dengan program IBM SPSS 25 (9th ed.) [Multivariate analysis application with IBM SPSS 25 program (9th ed.)]. Universitas Diponegoro.
Ghozali, I. (2021). Aplikasi analisis multivariate dengan program IBM SPSS 26 Edisi 10 [Multivariate analysis application with IBM SPSS 26 program (10th ed.)]. Badan Penerbit Universitas Diponegoro.
Godoe, P., & Johansen, T. S. (2012). Understanding adoption of new technologies: Technology readiness and technology acceptance as an integrated concept. Journal of European Psychology Students, 3, 38. https://doi.org/10.5334/jeps.aq
Hair, J. F., Sarstedt, M., Hopkins, L., & Kuppelwieser, V. G. (2014). Partial least squares structural equation modeling (PLS-SEM): An emerging tool in business research. European Business Review, 26(2), 106–121. https://doi.org/10.1108/EBR-10-2013-0128
Hendayani, R., & Febrianta, M. Y. (2020). Technology as a driver to achieve the performance of family businesses supply chain. Journal of Family Business Management, 10(4), 361–371. https://doi.org/10.1108/JFBM-10-2019-0070
Hermanto, M. R., Prasetio, A., & Ariyanti, M. (2023). The effect of user readiness acceptance Of Sijagger V2 using Technology Readiness Acceptance Model (Tram) (CASE Research: KPPBC TMP A Tangerang). International Journal of Science, Technology & Management. https://ijstm.inarah.co.id/index.php/ijstm/article/view/925
Hess, T., Matt, C., Benlian, A., & Wiesböck, F. (2016). Options for formulating a digital transformation strategy. https://www.researchgate.net/publication/291349362
Hutami, K. P., Pasaribu, R. D., & Sutjipto, M. R. (2022). Technology readiness & acceptance model and digital transformation strategy of Ciparay traditional market village, Bandung. In Sustainable Future: Trends, Strategies and Development (pp. 65–68). Routledge. https://doi.org/10.1201/9781003335832-17
Indrawati. (2015). Metode Penelitian Manajemen dan Bisnis: Konvergensi Teknologi Komunikasi dan Informasi [Management and Business Research Methods: Convergence of Communication and Information Technology]. Refika Aditama.
Kampa, R. K. (2023). Combining technology readiness and acceptance model for investigating the acceptance of m-learning in higher education in India. Asian Association of Open Universities Journal, 18(2), 105–120. https://doi.org/10.1108/AAOUJ-10-2022-0149
Kim, S., Jang, S., Choi, W., Youn, C., & Lee, Y. (2021). Contactless service encounters among Millennials and Generation Z: the effects of Millennials and Gen Z characteristics on technology self-efficacy and preference for contactless service. Journal of Research in Interactive Marketing, 16(1), 82–100. https://doi.org/10.1108/JRIM-01-2021-0020
Koufaris, M. (2002). Applying the technology acceptance model and flow theory to online consumer behavior. Information Systems Research, 13(2), 205–223. https://doi.org/10.1287/isre.13.2.205.83
Kuo, K. M., Liu, C. F., & Ma, C. C. (2013). An investigation of the effect of nurses’ technology readiness on the acceptance of Mobile Electronic Medical Record Systems. BMC Medical Informatics and Decision Making, 13(1). https://doi.org/10.1186/1472-6947-13-88
Kusumah, E. P., Huriyati, R., & Hendrayati, H. (2021). Self-service Technology Behavioral Intention: Indonesian Air Passengers [Paper presentation]. In 5th Global Conference on Business, Management and Entrepreneurship (GCBME 2020) (pp. 402-406). Atlantis Press.
Lee, H., & Leonas, K. K. (2021). Millennials’ intention to use self-checkout technology in different fashion retail formats: Perceived benefits and risks. Clothing and Textiles Research Journal, 39(4), 264–280. https://doi.org/10.1177/0887302X20926577
Lin, C. H., Shih, H. Y., & Sher, P. J. (2007). Integrating technology readiness into technology acceptance: The TRAM model. Psychology and Marketing, 24(7), 641–657. https://doi.org/10.1002/mar.20177
Na, T. K., Lee, S. H., & Yang, J. Y. (2021). Moderating effect of gender on the relationship between technology readiness index and consumers’ continuous use intention of self-service restaurant kiosks. Information (Switzerland), 12(7). https://doi.org/10.3390/info12070280
Narimawati, U., Sarwono, J., Sos, S., Affandi, H. A., & Priadana, H. S. (2020). Ragam Analisis dalam Metode Penelitian untuk Penulisan Skripsi, Tesis, & Disertasi [Types of Analysis in Research Methods for Writing Theses, Dissertations, & Thesis]. ANDI.
Noviaristanti, S., & Nugroho, T. A. (2024). Analysis of acceptance of the yes application using Tram at Pt. Indosat Ooredoo Hutchison in Sumatera. International Journal of Business and Management, 19(2), 159. https://doi.org/10.5539/ijbm.v19n2p159
Nugroho, M. A., & Andryzal Fajar, M. (2017). Effects of technology readiness towards acceptance of mandatory web-based attendance system. Procedia Computer Science, 124, 319–328. https://doi.org/10.1016/j.procs.2017.12.161
Oh, J. C., Yoon, S. J., & Chung, N. (2014). The role of technology readiness in consumers’ adoption of mobile internet services between South Korea and China. Journal of Advertising Research, Service Industries Journal and others. Electronic Commerce Research and Applications, 12(3). https://doi.org/10.1504/IJMC.2014.061460
Parasuraman, A. (2000). Technology Readiness Index (TRI) A multiple-item scale to measure readiness to embrace new technologies. Journal of Service Research, 2(4). https://doi.org/10.1177/109467050024001
Parasuraman, A., & Colby, C. L. (2015). An updated and streamlined technology readiness index: TRI 2.0. Journal of Service Research, 18(1), 59–74. https://doi.org/10.1177/1094670514539730
Peng, M. Y. P., & Yan, X. (2022). Exploring the influence of determinants on behavior intention to use of multiple media kiosks through technology readiness and acceptance model. Frontiers in Psychology, 13. https://doi.org/10.3389/fpsyg.2022.852394
Ramayah, T., & Ignatius, J. (2005). Impact of perceived usefulness, perceived ease of use and perceived enjoyment on intention to shop online. Journal of Systems Management, 3(3), 36–51. https://ramayah.com/journalarticlespdf/impactpeu.pdf
Rofadaliny, A. (2022). Analysis of the use of Learning Management System (LMS) CeLOE at Telkom University Bandung in the condition of the Covid-19 pandemic using social isolation model, system quality, corona fear, and Unified Theory of Acceptance and Use of Technology (UTAUT)[Universitas Telkom]. https://repositori.telkomuniversity.ac.id/pustaka/177402/analysis-of-the-use-of-learning-management-system-lms-celoe-at-telkom-university-bandung-in-the-condition-of-the-covid-19-pandemic-using-social-isolation-model-system-quality-corona-fear-and-unified-theory-of-acceptance-and-use-of-technology-utaut-.html
Rosli, M. S., Saleh, N. S., Md. Ali, A., & Abu Bakar, S. (2023). Factors determining the acceptance of E-Wallet among Gen Z from the lens of the extended technology acceptance model. Sustainability (Switzerland), 15(7). https://doi.org/10.3390/su15075752
Szajna, B. (1996). Empirical evaluation of the revised technology acceptance model. Management Science, 42(1), 85–92. https://doi.org/10.1287/mnsc.42.1.85
Santosa, P. I. (2018). Metode Penelitian Kuantitatif : Pengembangan Hipotesis dan Pengujiannya Menggunakan SmartPLS [Quantitative Research Methods: Hypothesis Development and Testing Using SmartPLS]. ANDI.
Saragih, C., Nafa Sari, C., Nurtjahyo Moch, B., & Muslim, E. (2020). Adoption of Electronic Medical Record in Hospitals in Indonesia based on technology readiness and acceptance model. ACM International Conference Proceeding Series, 79–85. https://doi.org/10.1145/3429551.3429565
Sekaran, U., & Roger, B. (2016). Research methods for business (7th ed.). John Wiley & Sons Ltd. www.wileypluslearningspace.com
Silva, G. M., Dias, Á., & Rodrigues, M. S. (2022). Continuity of use of food delivery apps: An integrated approach to the health belief model and the technology readiness and acceptance model. Journal of Open Innovation: Technology, Market, and Complexity, 8(3). https://doi.org/10.3390/joitmc8030114
Sugiyono. (2013). Metode Penelitian Kuantitatif, Kualitatif, dan R&D Metode [Quantitative, Qualitative, and R&D Research Methods]. Penerbit Alfabeta Bandung.
Straub, D., Limayem, M., & Karahanna-Evaristo, E. (1995). Measuring system usage: implications for IS theory testing. Management Science, 41(3), 1328–1342. https://doi.org/10.1287/mnsc.41.8.1328
Venkatesh, V., Morris, M. G., Davis, G. B., & Davis, F. D. (2003). User acceptance of information technology: Toward a unified view. MIS Quarterly, 27(3). https://doi.org/10.2307/30036540
Venkatesh, V., Smith, R. H., & Morris, M. G. (2000). Why don’t men ever stop to ask for directions? gender, social influence, and their role in Technology Acceptance and Usage Behaviour. In Technology Acceptance and Usage MIS Quarterly, 24(1). https://doi.org/10.2307/3250981
Walczuch, R., Lemmink, J., & Streukens, S. (2007). The effect of service employees’ technology readiness on technology acceptance. Information & Management, 44(2), 206–215. https://doi.org/10.1016/j.im.2006.12.005
Yahya, L. M., Rasyiddin, A., Muhlasin, Mariko, S., & Harsono, I. (2024). Analysis of user acceptance towards the implementation of information systems in financial institutions using technology readiness and acceptance model approach. Jurnal Informasi Dan Teknologi, 112–117. https://doi.org/10.60083/jidt.v6i1.483
Yusuf, F., Mirantika, N., Syamfithriani, T. S., Darmawan, E., & Irawan, D. (2021). Technology readiness and acceptance model as a factor for the use intention of LMS e-Learning in Kuningan University. Journal of Physics: Conference Series, 1933(1). https://doi.org/10.1088/1742-6596/1933/1/012005
Page 1 of
Download Count : 103
Visit Count : 365
Keywords
New Technology; TRAM; Self Check-in Technology; User Intention
Author(s) Information

How to cite this article
Shofi, S. A., & Ghina, A. (2025). The influence of user readiness on self check-in technology adoption: A study using TRAM method. European Journal of Studies in Management and Business, 33, 1-17. https://doi.org/10.32038/mbrq.2025.33.01
Acknowledgments
Not applicable.
Funding
Not applicable.
Conflict of Interests
No, there are no conflicting interests.
Open Access
This article is licensed under a Creative Commons Attribution 4.0 International License, which permits use, sharing, adaptation, distribution and reproduction in any medium or format, as long as you give appropriate credit to the original author(s) and the source, provide a link to the Creative Commons license, and indicate if changes were made. You may view a copy of Creative Commons Attribution 4.0 International License here: http://creativecommons.org/licenses/by/4.0/