


Original Research
Analysis of the Regional Economic Structure in Mexico (2019-2021)
- Abstract
- Full text
- Metrics
The objective of this research is to analyze the behavior of the dynamism and distribution of the economy in the regions of Mexico in the period 2019-2021. A brief explanation of economic growth and economic structure is provided, as well as the importance of territorial analysis for planning development strategies in the territories. The territorial analysis techniques applied in this work and the methodology for their implementation are explained. The work is based on the study of the dynamics and structure of the economy based on the "gross value added" indicator, which allows for measuring the contribution made by the different sectors in the municipalities. As a result of the research, the main economic activities within the regions of Mexico and those processes of structural change that have favored the development of the regions are identified. The most lagging sectors and the municipalities whose economic structure does not favor the dynamics demanded by their economic development are pointed out. Finally, a set of conclusions is reached that can be used to define strategies and public policies aimed at promoting investment and local economic development management.
Analysis of the Regional Economic Structure in Mexico (2019-2021)
Roberto Yoan Castillo Dieguez*,1, Martin Vivanco Vargas1, José Antonio Climent Hernández2, Ma. Benilde Rincón García1 |
1 Faculty of Accounting and Management, Autonomous University of Queretaro, Querétaro, Mexico 2 Department of System, Basic Sciences and Engineering, Metropolitan Autonomous University, Mexico |
| ABSTRACT |
The objective of this research is to analyze the behavior of the dynamism and distribution of the economy in the regions of Mexico in the period 2019-2021. A brief explanation of economic growth and economic structure is provided, as well as the importance of territorial analysis for planning development strategies in the territories. The territorial analysis techniques applied in this work and the methodology for their implementation are explained. The work is based on the study of the dynamics and structure of the economy based on the "gross value added" indicator, which allows for measuring the contribution made by the different sectors in the municipalities. As a result of the research, the main economic activities within the regions of Mexico and those processes of structural change that have favored the development of the regions are identified. The most lagging sectors and the municipalities whose economic structure does not favor the dynamics demanded by their economic development are pointed out. Finally, a set of conclusions is reached that can be used to define strategies and public policies aimed at promoting investment and local economic development management. |
Introduction
Currently, the challenges to make adjustments in the economic structure of countries are growing; given the current pandemic of COVID-19, the demands of regions, states, and countries have increased, which requires macroeconomic adjustments with policies aimed at an increase in productive and entrepreneurial development at the territorial level. Thus, it is necessary to implement local economic development initiatives, as pointed out by authors such as Barnet (2019), Dini and Correa (2019), Pérez (2018), Rojas (2018), Torres and Briones (Torres, 2019), which are forms of flexible adjustment to structural change that allow balances in macroeconomic indicators, as well as identifying potential markets in the territories.
Within this framework of ideas, local economic development can be expressed as a reflection of the national development process, also as actions aimed at achieving the progress of a given region and strengthening the interrelation of local actors in the proposal of strategies, in the decision-making process, as well as in the implementation of new projects and initiatives with the objective of minimizing existing inequalities between territories.
In Mexico, the local development initiatives implemented by recent governments have been insufficient. There are many municipalities in the different regions of Mexico, most of them rural, with a high degree of social marginalization. The current government seeks to pay greater attention to those with greater needs. There is an attempt to place communities above the entrepreneurial nature of self-benefit and adjust the conceptualization of enterprise and its way of organization (Espinosa & Herrero, 2020; González et al., 2019; Martínez et al., 2020). An analysis of the Human Development Index (HDI) shows that wealth is concentrated mainly in five states of the republic (Mexico City, State of Mexico, Nuevo León, Morelos, Oaxaca). Likewise, Oaxaca, Chiapas, Veracruz, and Guerrero are the states with the poorest municipalities in the country.
Considering the elements raised, it is considered a problem to be analyzed in the present research: What elements have been marking the economic development processes and change of the economic structure in the regions of Mexico in the period 2019-2021?
Therefore, the objective of this research is to analyze the dynamics and structure of the economy of the regions of Mexico from 2017 to 2019. First, a theoretical review of the need to measure and analyze the growth and structure of the economy is made. Subsequently, the section on materials and methods is developed, and a theoretical and methodological analysis of the Regional Analysis Techniques is carried out. Finally, a set of conclusions and recommendations are drawn based on the results obtained in the research.
Theoretical framework
Growth and economic structure in local development
In the second half of the 80s of the 20th century, mainly in Europe, regional development was directed to local management projects, and the discussion about the possible concepts of "Local Development" related to the economic dynamics of cities and regions began.
Various authors such as Alburquerque (1996), Boisier (1999), Cárdenas (2002), Coraggio (2006), Cossio (2003), Mattos (2000), Pérez (2011), Tello (2010), Vázquez Barquero (2000) have put forward dissimilar concepts of local development; however, they coincide in one objective: the improvement, basic well-being and quality of life through the valorization of the endogenous resources of each territory and its entrepreneurial forces. Therefore, for local development to be effective, its main element is the economic base of the territory, which is why the economic dimension, seen or represented by "local economic development", is understood as an element at the core of the local development process.
Seen from this perspective we can refer to local economic development, which evolved as a policy approach in the early 1970s in response to observation by municipal governments. As the business sector and investments moved from region to region in search of a greater competitive advantage over their competitors. By studying their economic base, communities were able to understand their opportunities and obstacles to achieving growth and attracting investment. With this new understanding, communities sought to expand their economic and employment base through the design and implementation of strategic programs and projects to remove obstacles and facilitate investment.
In recent years, new views have emerged regarding economic development at the local level as opposed to the exogenous development approach, which encouraged external capital and business to promote development in the regions. This perspective has been redefined by adopting economic development as a bottom-up process characterized by the interrelation of local actors aimed at increasing economic growth. In other words, local economic development implies a process of change in economic structure, resource management efficiency, and environmental protection.
Territorial analysis and techniques used
Development planning processes at the local and territorial scale generally involve a set of analyses and diagnoses that make it possible to deepen the knowledge of the explanatory variables of the behavior of that territory, such as its potential, needs, and the evolution of development. What factors have been explaining this evolution over the years? What issues are influencing the processes of transformation of the territory? These are questions that make analysts constantly search for techniques and methods to explain these phenomena.
Among these techniques, there have been trends associated with the measurement of development and others more closely linked to territorial diagnosis processes. In the case of development measurement, there are efforts associated with defining synthetic development indexes. These are used in different countries, presenting different criteria according to the conception of development. These indexes generally have several dimensions, being considered composite indexes. There are also different diagnostic tools that make it possible to deepen the territorial analysis, such as methodologies of the Latin American Institute for Economic and Social Planning (ILPES-ECLAC) and the Economic Commission for Latin America and the Caribbean (ECLAC) for territorial diagnosis.
However, the main Regional Analysis Techniques (TAR) were devised by North American researchers, where the work carried out by Isard (1971Isard) stands out, with the proposal of a methodology for regional analysis.
In our continent, most of the studies related to the TAR can be found in guidelines and texts prepared by ECLAC researchers. The promotion and generalization of the TAREA software makes it possible to obtain coefficients that answer questions such as: What does the territory have, and what is its strength? How does it use what it has? Within this framework, the research of authors such as Sergio Boisier (1980) and Lira & Quiroga (2009) is relevant; the points of view they analyzed present great similarities and differences in the methodological steps to carry out the territorial analysis.
Methodology
In order to study the economic structure of Mexico's regions, the country was divided into eight regions: Northwest NW (Baja California, Baja California Sur, Chihuahua, Durango, Sinaloa, Sonora); Northeast NE (Coahuila, Nuevo León, and Tamaulipas); West W (Colima, Jalisco, Michoacán, and Nayarit); East OR (Hidalgo, Puebla, Tlaxcala and Veracruz); Central-North CN (Aguascalientes, Guanajuato, Querétaro, San Luis Potosí and Zacatecas); Central-North CN (Aguascalientes, Guanajuato, Querétaro, San Luis Potosí and Zacatecas); Central-South CS (Mexico City, Mexico State, Morelos); Southwest SW (Chiapas, Chiapas, Chiapas, Mexico State, Morelos); South-Central CS (Mexico City, Estado de México, Morelos); Southwest SO (Chiapas, Guerrero and Oaxaca) and Southeast SE (Campeche, Quintana Roo, Tabasco and Yucatán).
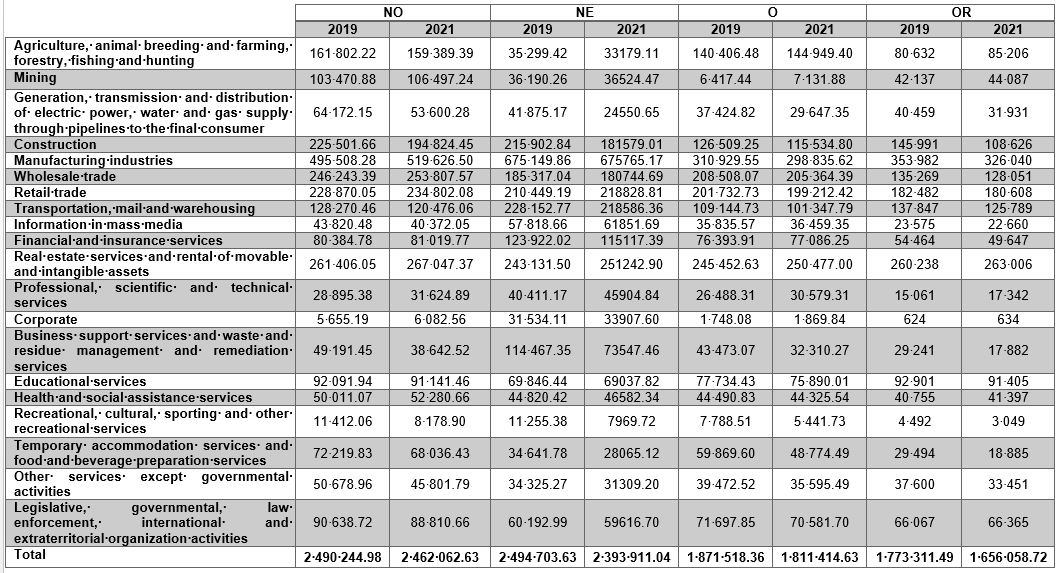
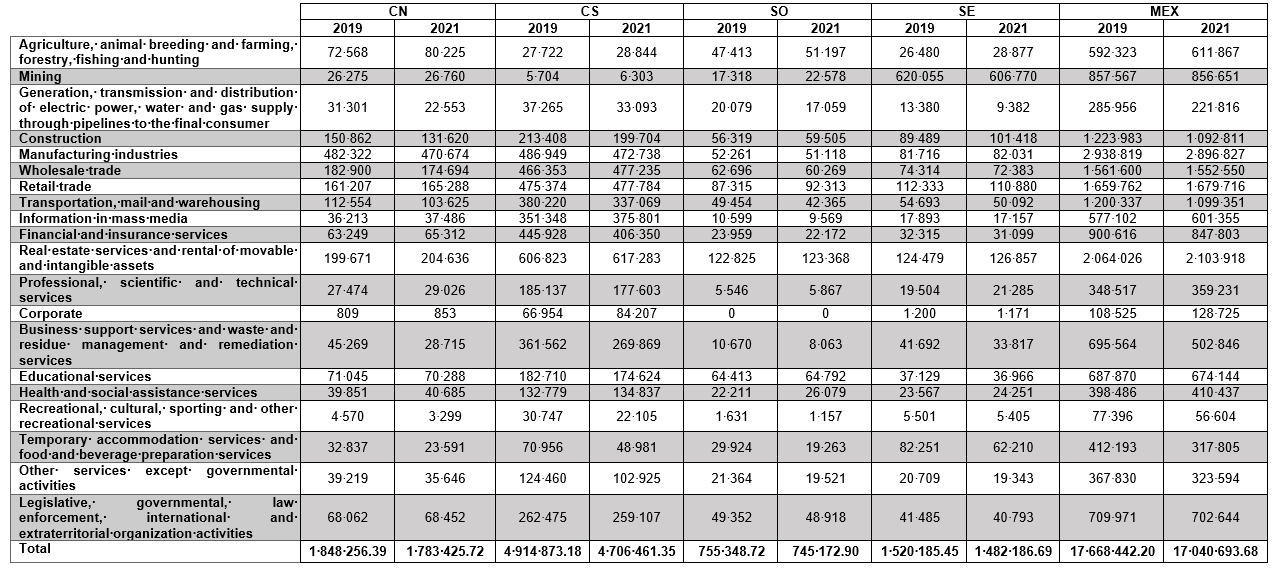
For the calculation of the coefficients, once the gross value-added data for the eight regions and sectors of the economy have been obtained, the data are grouped in a matrix known as the SECRE (Sector-Region) matrix, which contains the economic activities in the rows and each of the regions in the columns. Figure 1 shows the composition of this table.
Figure 1.
Structure of the SECRE matrix.
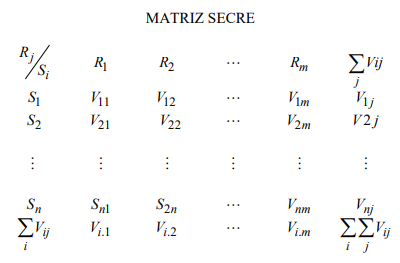
Based on Boisier (1980) and Lira & Quiroga (2009).
Where:

Regional specialization
Territorial specialization can be analyzed from two points of view: specialization within the territory and specialization at the country level.
Internal specialization is obtained from the quotient between the value of economic activity and the gross agricultural value of the region. It is calculated as follows:
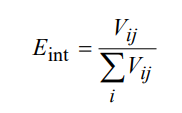
The values of internal specialization are greater than and equal to 0 and less than and equal to 1. The closer the values are to 1, the greater the importance of that activity in the region.
External specialization is obtained by the quotient between the internal specialization of the region in a given economic activity and the internal specialization of that activity in the country. For this reason, it is known as the location quotient.
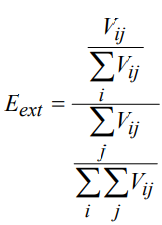
Its values can be equal to, less than or greater than 1; values greater than 1 indicate a higher degree of specialization of that activity at the country level.
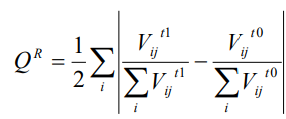
Similarity between regional and national economic structure
It is obtained from the calculation of the diversification coefficient equation:
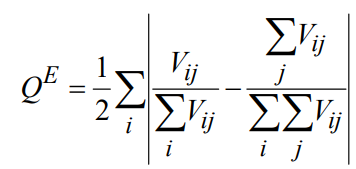
The diversification coefficient takes values greater than or equal to zero. In other words, the further the values are from zero, the greater the differences between the regional and national structure.
Considering the previous point of view, Miranda (1995) proposes a classification range for this coefficient:
Relatively similar QE < 0.10
Moderate differences 0.10 ≤ QE < 0.30
Significant differences 0.30 ≤ QE < 0.50
Highly significant differences 0.50 ≤ QE < 0.65
Strong differences QE ≥ 0.65
Temporary permanence of the economic structure
As a complement to the diversification coefficient, it is necessary to establish the level of transformations that the economic structure has undergone in the period of time analyzed. For this purpose, the Restructuring Coefficient is calculated, which allows us to know the variation of the economic structure in two time periods.
The Restructuring Coefficient takes values between zero and one, and for its study, we can use the classification criteria of the diversification coefficient. Values closer to zero mean that in the period there were minimal changes in the economic structure of the region.
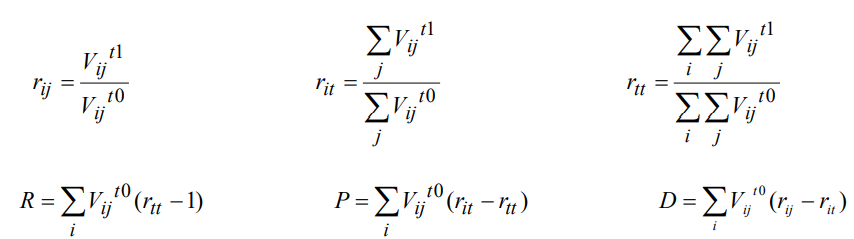
Economic dynamics and structure.
The regional analysis identifies three main components that show the changes that have occurred in terms of economic dynamics:
Total variation (R), also known as total effect, can be interpreted as the magnitude that the variable under study would have reached if the region had behaved similarly to the country.
Additional or structural variation (P). It is obtained as a result of the structural composition of the territory; its calculation takes into account the difference between the structure of the territory with the growth of the global rate. It can take values greater or less than zero. In the first case, it indicates that the territory has a specialization in fast-growing sectors at the national level (SRC). In the second case, its specialization is in slow-growing sectors at the national level (SLC).
Differential variation (D). This is because certain sectors' growth rate was higher (or lower) in the territory than the national average. Hence, it is indicated as a measure of territorial competitiveness.
From the above, it can be concluded that the real variation of the indicator is broken down into the three components mentioned above, which are hypothetical in nature.
Another necessary aspect for territorial analysis is the calculation of the gain or loss of a region because its behavior does not have the same growth rate as that of the country. To do this, the net change is calculated, which is obtained by subtracting the real variation from the total variation. The result can be greater or less than zero.
If CN > 0, it indicates that the real variation of the territory was above the hypothetical variation, i.e., what the hypothetical gained by having grown at a higher rate than that of the comparison pattern.
If CN < 0, it represents what it hypothetically "lost" by not having varied at the rate of the pattern. In this case, the behavior of the territory in question is below that of the comparison pattern and is, therefore, in a disadvantageous situation.
The following formulas are used to calculate these coefficients:
Results
The following results were obtained from applying the set of regional analysis techniques:
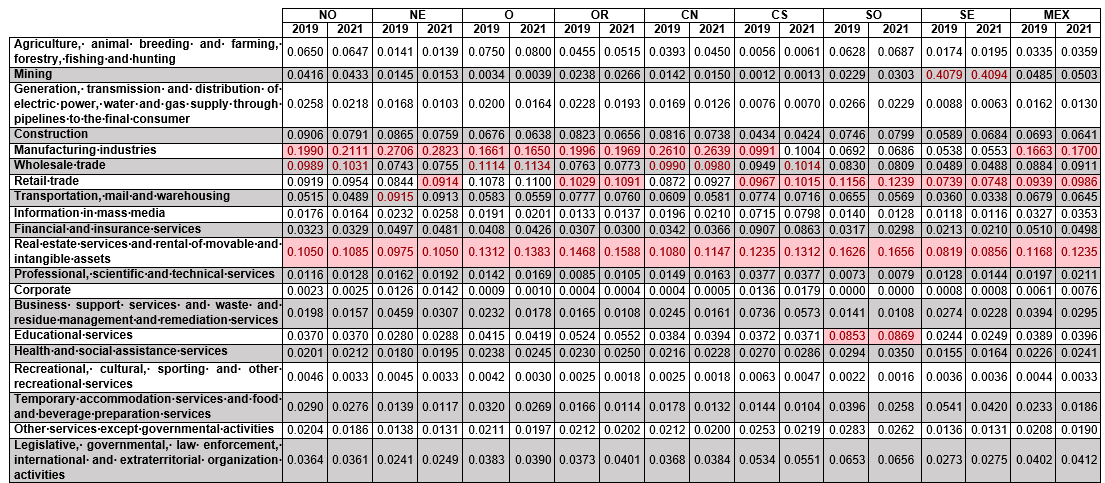
Internal specialization
In general, it can be observed that in most regions, there is a high specialization in the Real Estate Services and Rental of Movable and Intangible Goods sector. Some regions, such as the Northwest, Northeast, West, East, North Central, and South Central, stand out in the manufacturing industry sector, while in other regions, the Wholesale Trade sector (Northwest, West, North Central). It should be noted that retail trade activity also affects most regions, although with a weaker influence in the Northeast, West, and North Central regions.
Based on the information obtained from the calculation of the internal specialization coefficient, the following is a summary interpretation of the economic situation by region in Mexico in 2019 and 2021, taking into account the main economic activities:
In the regional analysis of the economic development of various areas between 2019 and 2021, it is highlighted that in the Northwest Region, during 2019, manufacturing industries were the main activity with 19.90%, followed by real estate services and rental of movable and intangible goods with 10.50%, and construction with 9.06%; two years later, in 2021, an increase in manufacturing industries was evidenced by reaching 21.11%, and a slight rise in real estate services with 10.85%, even though construction experienced a decrease to 7.91%.
On the other hand, in the Northeast Region, in 2019, the manufacturing industry predominated with 27.06%, followed by real estate services at 9.75%, and transportation, post, and storage at 9.15%. However, by 2021, manufacturing industries increased to 28.23%, real estate services grew to 10.50%, while the transportation, post, and storage sectors remained almost constant at 9.13%.
In the West Region, the 2021 figures show a similar behavior to 2019, when manufacturing industries led with 16.61%, followed by real estate services with 13.12%, and wholesale trade with 11.14%. Meanwhile, in the Eastern Region, 2019 was marked by a predominance of manufacturing industries at 20.40% and real estate services at 14.56%, with retail trade in third place with 10.29%; although, in 2021, growth in real estate services was observed to reach 15.88% and a slight decrease in manufacturing industries with 19.69%.
Simultaneously, in the North Central Region, manufacturing industries were the dominant activity in 2019 with 26.10%, followed by real estate services at 10.80%, and wholesale trade at 9.90%; by 2021, a slight increase was noted in manufacturing industries to 26.39% and real estate services reaching 11.47%. In turn, in the Centrosur Region, real estate services ranked first at 12.35% in 2019, followed by wholesale trade at 9.49% and financial and insurance services at 9.07%; by 2021, real estate services showed an increase to 13.12%, while the other two activities remained relatively constant.
In the Southwest Region, in 2019, real estate services dominated with 16.26%, followed by wholesale trade with 8.30% and construction with 7.46%, noting an increase in real estate services to 16.56% in 2021. Finally, in the Southeast Region, mining was the predominant activity in 2019, with a remarkable 40.79%, followed by real estate services at 8.19% and retail trade at 7.39%; in 2021, mining remained strong at 40.94%, while real estate services experienced a slight growth to 8.56%.
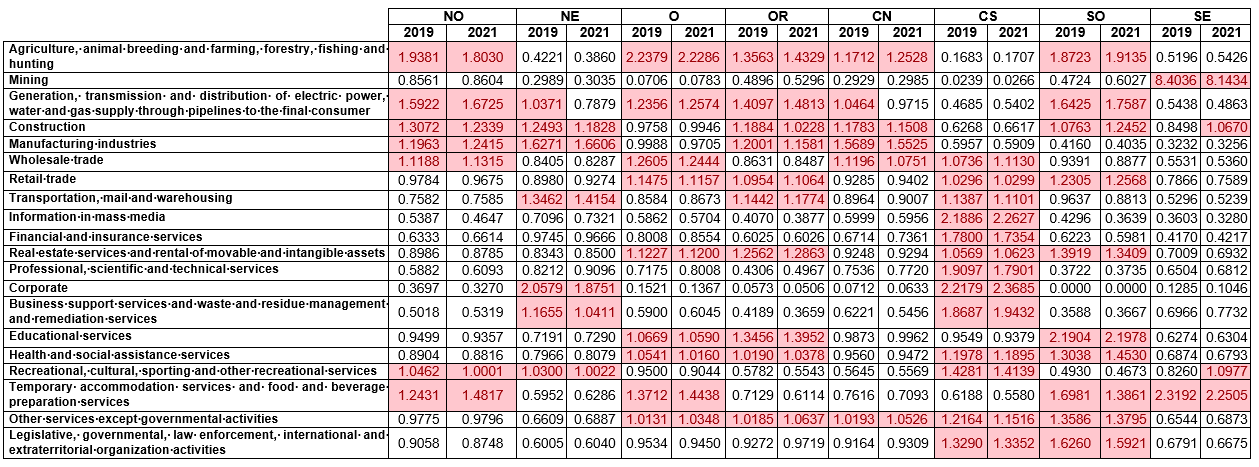
External specialization
External specialization helps to identify the preponderant economic activities in different regions of the country, showing which ones outperform the national average. From the analysis of the data between 2019 and 2021, several significant observations can be drawn.
Agriculture, animal husbandry, forestry, fishing, and hunting are particularly prominent in the Northwest, West, East, and North Central regions, with the West region significantly outperforming the national average in both years. In addition, the Southeast region exhibits notable specialization in mining, with a location quotient significantly greater than 1, particularly in 2021.
As for the generation, transmission, and distribution of electricity, as well as the supply of water and gas through pipelines to the final consumer, a significant presence is observed in several regions, including the Northwest, East, North Central, and Southwest. It is important to note that these regions maintained a relatively high specialization in 2021, with a notable increase in the Southwest region.
On the other hand, the manufacturing industry, an important pillar of the Mexican economy, shows a significant concentration in the Northwest, Northeast, West, and East regions. The Northeast region, in particular, has shown continued growth in this sector, surpassing the national average in 2021.
Likewise, a notable growth in the temporary accommodation and food and beverage preparation sector is highlighted in the Northwest region between 2019 and 2021. It is also important to highlight that the Southeast region maintains a significant specialization in this sector.
In summary, the analysis of the location quotient indicator reveals considerable regional specialization in several economic activities. The South Central region, for example, proves to be a focal point for several activities, with a location quotient that exceeds 1 in several categories, indicating a high concentration of specialization compared to the national average.
Similarity of structure
In order to make a more accurate interpretation of the data provided, it is necessary to pay attention to several dimensions of the economic structure of each region and their evolution from 2019 to 2021.
First, the Southeast region stands out for a significant difference compared to the other regions and the country in general, especially in terms of mining, with an index of 0.3593 in 2019 and 0.3591 in 2021, indicating a high specialization in this sector. This is also reflected in its diversification coefficient, which is considerably higher (0.39 in both years) than other regions, indicating a lower diversification in its economic activities.
In contrast to the Southeast, the other regions exhibit a more equitable diversification in various economic sectors, reflected in lower diversification coefficients, varying from 0.11 to 0.22 in the period considered. These regions maintain a moderate difference compared to the economic structure of the country, which could indicate a more balanced distribution of economic activities in various sectors.
Additionally, it can be noted that several regions have experienced changes in their industrial and manufacturing sectors. For example, the Northeast region has had a notable increase in manufacturing industries, moving from an index of 0.1043 in 2019 to 0.1123 in 2021.
Regarding construction, there is a notable decrease in many regions, which could indicate a contraction of this sector during the period analyzed. The Southwest region, for example, has experienced a significant decline, with the index falling from 0.0131 to 0.0015.
To conclude this analysis, it is important to highlight that the data indicate certain significant patterns and trends in the economic structure of the different regions over the 2019-2021 period. The Southeast region's marked specialization in the mining sector points to both strengths and potential vulnerabilities that could result from an over-reliance on one particular sector. The stability in its diversification coefficient suggests that there have been no significant changes in the economic structure of this region over the period analyzed.
Temporary permanence of the economic structure
For a more accurate interpretation of the data provided for 2019 and 2021, it is essential to analyze several dimensions of the economic structure of each region.
At first glance, we can observe that all regions have experienced a "relatively similar" change in their structural process, with restructuring coefficients fluctuating between 0.02 and 0.04. However, when we get into the details, we can identify significant differences in certain economic sectors.
For example, it can be noted that the Southwest region stands out significantly in the mining sector with an index of 0.0074, which could indicate a notable specialization or focus in this area. In addition, this region also shows a strong presence in the "Temporary accommodation and food and beverage preparation services" sector, with an index of 0.0138.
On the other hand, the Oriente region shows marked participation in the construction sector with an index of 0.0167, potentially indicating a construction boom or infrastructure development in that area during the period analyzed.
Economic activity in construction and wholesale trade are sectors that have shown notable variation in several regions. For example, the Northwest region has experienced a considerable increase in the "Business support services and waste and refuse management and remediation services" sector, reflected in an index of 0.0152.
In conclusion, it is clear that while the regions have maintained a "relatively similar" restructuring, there are significant differences at the sectoral level that may indicate unique economic trends and development opportunities in each region. These details can be crucial in designing specific regional development policies and strategies that seek to capitalize on the unique strengths of each region and foster equitable growth throughout the country.
Differential-structural analysis: Specialization and competitiveness
Total variation or total effect
The total effect reflects the growth trend that a region would have observed if its rate of expansion had been in line with the national growth rate. In this analysis, it appears that all regions have experienced a negative total effect, indicating that their growth was below the national average in the period studied. In this case, the Centrosur, Northwest, and Northeast regions show a considerable slowdown, as evidenced by their total effect values of -174 622.32, -88 476.82 MP, and -88 635.23 MP, respectively.
Structural variation
The data indicate a significant variation in the structural effects between regions. It is notable that some regions, despite having a negative total effect, have managed to grow in certain areas; such is the case of the East, West, and North Central regions, which had a significant increase with 7162.91, 6118.30 MP and 5098.26, respectively. This could suggest that the regions are benefiting from specialization in fast-growing sectors. However, other regions show a negative trend in several areas, such as the Centrosur region, which has pronounced negative values in the Total Variation and Structural Variation categories.
Differential effect
In the current economic landscape, a clear distinction can be observed between regions that are experiencing a positive Differential Effect (DE) and those facing a negative trend.
On the positive side of the scale, we find the Northwest region, which stands out significantly with a positive DE of 58,177.02 MP, indicating a notable strength in certain sectors that are outperforming the national growth average. In addition, the Southwest and Southeast regions have also exhibited signs of healthy sectoral growth, registering DE values of 15,398.40 MP and 11,961.36 MP, respectively, pointing to a favorable growth trend that exceeds the national average.
In contrast, several regions show negative DE trends, indicating areas where territorial competitiveness is falling behind the national pace. Specifically, the Northeast region is experiencing a slight retraction with a DE of -1,505.95 MP, evidencing a decline in sectoral competitiveness. The East region, on the other hand, has witnessed a significant decline with a DE of -61,411.05 MP, indicating a weakened competitive position and a slower pace of growth in several sectors. Similarly, the Centronorte and Centrosur regions have registered negative DE values, -4,261.56 MP and -18,630.04 MP, respectively, highlighting an urgent need to re-evaluate and adapt economic strategies to regain competitiveness.
In summary, the Differential Effect analysis reveals a clear dichotomy in territorial competitiveness among regions, highlighting both areas of opportunity and points of strategic review needed to foster balanced and robust growth across the country.
Net change
The net change reflects a more complex mix of factors, incorporating both the total and structural effects. Here, we observe that while regions such as the Northwest and Southeast have managed to maintain a positive net change (60,294.47 MP and 16,012.46 MP, respectively), other regions have experienced a decrease. Notably, the Centrosur region has experienced a significantly negative net change (-33,789.51 MP), highlighting weak territorial competition and slower growth than the national average. This suggests an urgent need to review and adjust its economic strategies to revitalize its competitiveness in the national market. Figure 2 shows the classification of regions according to Boudeville and Montefiore (1966).
Figure 2.
Boudeville and Montefiore (1966) classification of Mexico's regions (2019-2021).
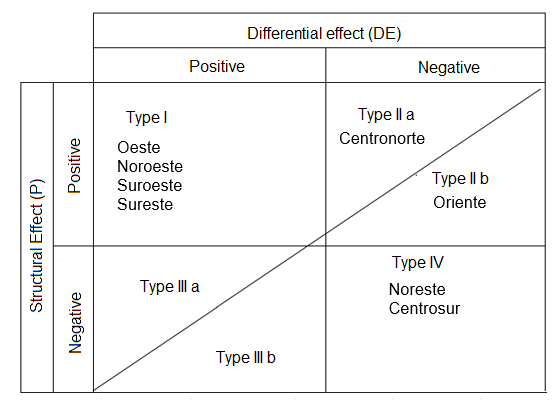
Generic strategies
The Type I regions represented by the Northwest, West, Southwest, Southwest, and Southeast regions are leaders with a favorable structure, specializing in SRC industries and proving to be competitive in their activities. Their strategies should focus on maintaining their leadership.
Type II-a: The North Central region fits into this category, with a positive P value, a positive net change, but a negative DE. Although it has a robust economic structure, it needs to work on improving its competitiveness on the national stage. Strategies should focus on strengthening the sectors where they are encountering challenges.
Type II-b is the Eastern region in this category, showing a positive P value, a negative net change, and a negative DE. The strategy for this region should focus on improving its competitiveness, while maintaining its specialization in faster-growing sectors. This would imply a review and readjustment of its current economic structure to reverse the negative trend in its net change.
Type IV: The Northeast and Centrosur regions are characterized by negative values in all categories (DE, P, and Net Change), indicating an urgent need for strategies aimed at making radical changes both from a structural and competitiveness point of view.
Conclusions
As mentioned by Coraggio (2014), the identification of potentialities in the regions allows the development of public policies aimed at promoting a more social and supportive economic system that reduces socioeconomic inequalities and promotes changes within the economic structure to achieve efficiency and sustainable management of resources. Regional analysis techniques are a tool of great importance for decision-makers in local governments as they provide relevant information on local management processes.
The most representative sectors that mark the processes of the economic dynamics and structure of the regions in Mexico are Agriculture, animal breeding and exploitation, forestry, fishing and hunting, Generation, transmission, and distribution of electric power, water, and gas supply through pipelines to the final consumer, Construction, Other services except governmental activities and manufacturing industry.
Finally, the Northwest, Northeast, East, and South Central regions grew at a higher rate than if they had grown at the country's average rate, although in the case of the Northwest region, there were problems because its economic structure is oriented towards slow-growth sectors. Meanwhile, the West, North Central, Southwest, and Southeast regions grew at a lower rate than if they had grown at the country's average rate; the Southwest region was the most unfavorable, as it presents problems in its competitiveness and specializes in slow-growth sectors at the country level.
References
Alburquerque, L. F. (1996). Local economic development and distribution of technical progress: a response to the demands of structural adjustment.
Barnet, O. (2019). Local economic development policies. what if we rethink the basics? TERRA: Journal of Local Development, (5), 105-125.
Boisier, S. (1980). Cuaderno del ILPES No. 27" Técnicas de análisis regional con información limitada. Santiago de Chile. https://repositorio.cepal.org/server/api/core/bitstreams/6b6152bc-6e34-4663-bd94-33acaaefe71e/content
Boisier, S. (1999). Local Development: What are we talking about? Chamber of Commerce of Manizales Colombia (pp. 1-28).
Boudeville, J. R., & Montefiore, C. G. (1966). Problems of regional economic planning. Edinburgh: Edinburgh UP.
Cárdenas, N. (2002). El desarrollo local su conceptualización y procesos. Provincia, (8), 53-76. https://www.redalyc.org/articulo.oa?id=55500804
Coraggio, J. L. (2006). On some relations between the theory and practice of local development. Universidad y Desarrollo Local. Buenos Aires. Prometeo-UNGS.
Coraggio, J. L. (2014). The social and solidarity economy and the role of the popular economy in the economic structure. La economía Popular y Solidaria. The Human Being Over Capital, 2007-2013, 21-46.
Cossio, L. (2003). La cuestión regional y local en América Latina. Latin American and Caribbean Institute for Economic and Social Planning (ILPES-CEPAL).
Dini, M., & Correa, F. (2019). Local economic development policies in Chile’s municipalities: beyond welfarism. CEPAL Journal.
Espinosa-Márquez, A., & Herrero, E. C. (2020). Agenda 2030 and Sustainable Development. A Challenge for Local Governments in Mexico.
González, Y., Palmas, Y. D., Vargas, E. E., & Serrano, R. (2019). A business cooperation network for the local development "Las Truchas" tourism corridor, Mexico. Estudios y Perspectivas en Turismo, 28(1), 207-225. https://www.redalyc.org/articulo.oa?id=180758568011
Isard, W. (1971). Análisis de la localización industrial y medidas afines. Métodos de análisis regional.
Lira, L., & Quiroga, B. (2009). Técnicas de análisis regional, Serie Manuales No 59. Santiago de Chile. https://repositorio.cepal.org/server/api/core/bitstreams/c6aa2d07-862d-465e-b3d1-a1f8259e367a/content
Martínez, C., Martinez, K. A., Martinez, L. A., & Miguel, A. E. (2020). Relationship between public management and sustainable local development in the cities of Oaxaca, 2000-2017. Revista iberoamericana de estudios municipales, (22), 155-187. https://dx.doi.org/10.4067/S0719-17902020000200155
Mattos, C. A. d. (2000). New theories of economic growth: a reading from the perspective of peripheral territories. Revista de estudios regionales, (0213-7525), 15-44.
Miranda, M. (1995). Territorial Planning: a methodological approach. Bolivia: Universidad Técnica de Oruro.
Pérez, G. O. (2011). The economic structure and its impact on local development. OIDLES Magazine, 5.
Pérez, M. (2018). Sustainable local development. Revista Economía y Desarrollo (Impresa), 140(2).
Rojas Arenas, I. D. (2018). From economic development to endogenous economic development: a look from complex thinking. Revista CINTEX, 23(1), 12-23. https://doi.org/10.33131/24222208.308
Tello, M. D. (2010). From national economic development to local development: theoretical aspects. CEPAL Review, 51, 17.
Torres, F., & Briones, X. (2019). Innovation and entrepreneurship in the sustainability of Local Economic Development. Revista de Ciencias Sociais, Humanas e Engenharias, 4(2), 294-305. http://doi.org/10.37293/sapientiae42.09
Vázquez Barquero, A. (2000). Local economic development and decentralization: approach to a conceptual framework.
Annex 1.
SECRE Matrix for 2019 and 2021
Annex 2.
Internal specialization of the regions
Annex 3.
Internal specialization of the region
Annex 4.
Specialization and competitiveness coefficients
NO | NE | O | OR | CN | CS | SO | SE | |
ET (R ) | -88 476.82 | -88 635.23 | -66 493.86 | -63 004.63 | -65 667.37 | -174 622.32 | -26 837.06 | -54 011.22 |
EE (P) | 2 117.45 | -10 651.40 | 6 118.30 | 7 162.91 | 5 098.26 | -15 159.46 | 1 262.84 | 4 051.10 |
ED (D) | 58 177.02 | -1 505.95 | 271.83 | -61 411.05 | -4 261.56 | -18 630.04 | 15 398.40 | 11 961.36 |
NC | 60 294.47 | -12 157.35 | 6 390.13 | -54 248.14 | 836.70 | -33 789.51 | 16 661.24 | 16 012.46 |
Page 1 of
Download Count : 194
Visit Count : 559
Keywords
Regional Specialization; Economic Growth; Regional Analysis Techniques
Author(s) Information

How to cite this article:
Dieguez, R.Y.C., Vargas, M.V., Hernandez, J.A.C., & Garcia, M.B.R. (2024). Embedding Countries Governance in Assessing Companies' Sustainable Development Goals (SDGs) Reporting: A Quantitative Analysis. European Journal of Studies in Management and Business, 29, 18-35. https://doi.org/10.32038/mbrq.2024.29.02
Acknowledgments
Not applicable.
Funding
Not applicable.
Conflict of Interests
No, there are no conflicting interests.
Open Access
This article is licensed under a Creative Commons Attribution 4.0 International License, which permits use, sharing, adaptation, distribution and reproduction in any medium or format, as long as you give appropriate credit to the original author(s) and the source, provide a link to the Creative Commons license, and indicate if changes were made. You may view a copy of Creative Commons Attribution 4.0 International License here: http://creativecommons.org/licenses/by/4.0/